Database Open Access
CogWear: Can we detect cognitive effort with consumer-grade wearables?
Michal K Grzeszczyk , Rosmary Blanco , Paulina Adamczyk , Maciej Kus , Sylwia Marek , Ryszard Pręcikowski , Aneta Lisowska
Published: March 31, 2023. Version: 1.0.0
When using this resource, please cite:
(show more options)
Grzeszczyk, M. K., Blanco, R., Adamczyk, P., Kus, M., Marek, S., Pręcikowski, R., & Lisowska, A. (2023). CogWear: Can we detect cognitive effort with consumer-grade wearables? (version 1.0.0). PhysioNet. https://doi.org/10.13026/5f6t-b637.
Please include the standard citation for PhysioNet:
(show more options)
Goldberger, A., Amaral, L., Glass, L., Hausdorff, J., Ivanov, P. C., Mark, R., ... & Stanley, H. E. (2000). PhysioBank, PhysioToolkit, and PhysioNet: Components of a new research resource for complex physiologic signals. Circulation [Online]. 101 (23), pp. e215–e220.
Abstract
The CogWear database consists of two datasets: pilot and survey gamification experiment. The pilot dataset includes physiological signals from 11 volunteers captured by three wearable devices (Empatica E4 watch, Samsung Galaxy Watch4 and Muse S EEG headband) during cognitively demanding task (Stroop test) and baseline condition (no engagement in any activity). The pilot dataset was collected to evaluate the experimental setup and the signal captured by the wearables. In particular, can we detect when people perform a cognitively demanding task using data from consumer-grade smartwatches. The survey gamification experiment dataset includes physiological signal collected from 13 volunteers by three wearable devices (Empatica E4 watch, Samsung Galaxy Watch4 and Muse S EEG headband) during two sessions. In both sessions participants, as in the pilot study, engaged in a cognitively demanding task then rested and did not perform any tasks and finally filled in four mobile surveys related to work and wellbeing (GRIT, PANAS, HAPPINES and NFR). The mobile surveys were either gamified or not. The volunteers were divided into two groups: group 1 filled in gamified surveys in the first session and non-gamified surveys in the second session, group 2 had the opposite order. There was a two-week break time between the sessions. This dataset was captured to investigate whether simple gamification has an impact on the cognitive burden of filling in the surveys.
Background
Biosignals captured by wearables in different cognitive states can be used for development of machine learning models for unobtrusive and real-time cognitive load detection [10]. Seamless estimation of user cognitive load could facilitate in turn development of context-aware notifications and evaluation of application use effort in the wild. Publicly available datasets captured physiological signal using dedicated research devices such as Empatica E4 [10]. We capture data from three different devices to comparatively assess their utility in cognitive load estimation including a consumer-grade Samsung smartwatch. We are interested to check if signal obtained from cheaper and more popularly used devices can be used to infer changes in cognitive states that might guide just-in-time intervention (as speculated here [11]). Further, we capture physiological signal during interaction with mobile survey applications in two versions: gamified and standard (not gamified) to investigate the impact of gamification on cognitive burden. The signal captured in this condition could be also considered as a semi-cognitively challenging task for multiclass model training.
Methods
The data collection process was divided into two stages: pilot study and survey gamification experiment. The pilot study was conducted to test the experimental setup. We include the results of this phase for the possibility of broader data analysis and to provide access to more data samples. During this stage, the participants took part in two tasks: Stroop test [1] and baseline (no engagement in any activity).
Stroop test. It is a psychological experiment consisting of a cognitively demanding task. The participants are asked to name the ink color of a word which is the name of the color (most often different color than the ink). Participants indicate the ink's color by pressing one of the four keys, r, g, b, and y, which stand for red, green, blue and yellow. This task is cognitively demanding as it requires the participant to deeply focus to choose the right color (instead of selecting the displayed color name). We use the implementation of Stroop test from the website psytoolkit.org [2].
Baseline condition. During the baseline condition phase, the volunteers were asked to sit in a relaxed position for three minutes. During this time, the participants were not involved in distracting situations and were not allowed to perform any task.
The survey gamification experiment consisted of three tasks conducted two times with a two-week break between each session. The tasks were: cognitively demanding Stroop test, baseline (no engagement in any activity) and filling in four surveys. The first two tasks were conducted the same way as during the pilot study.
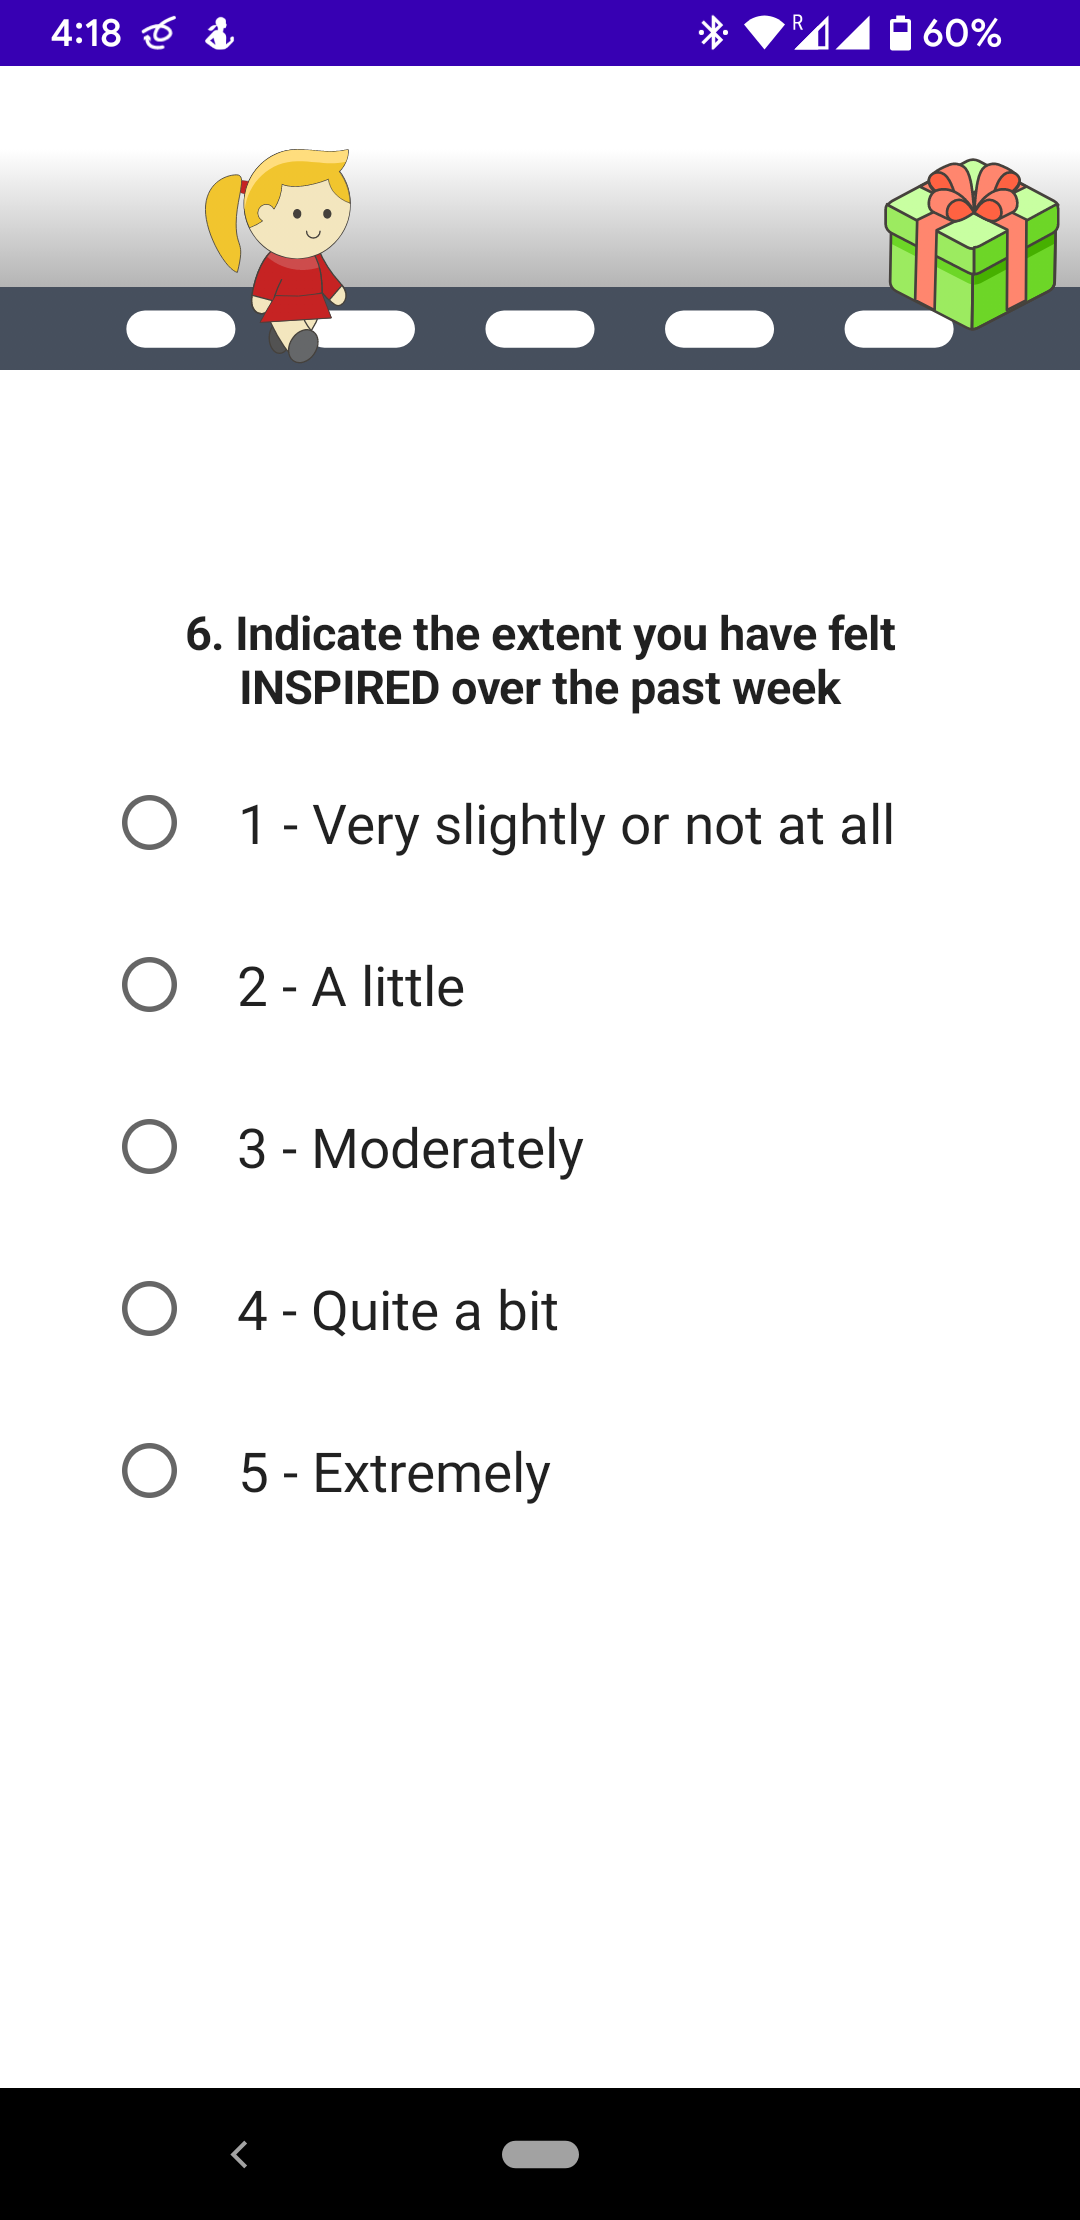
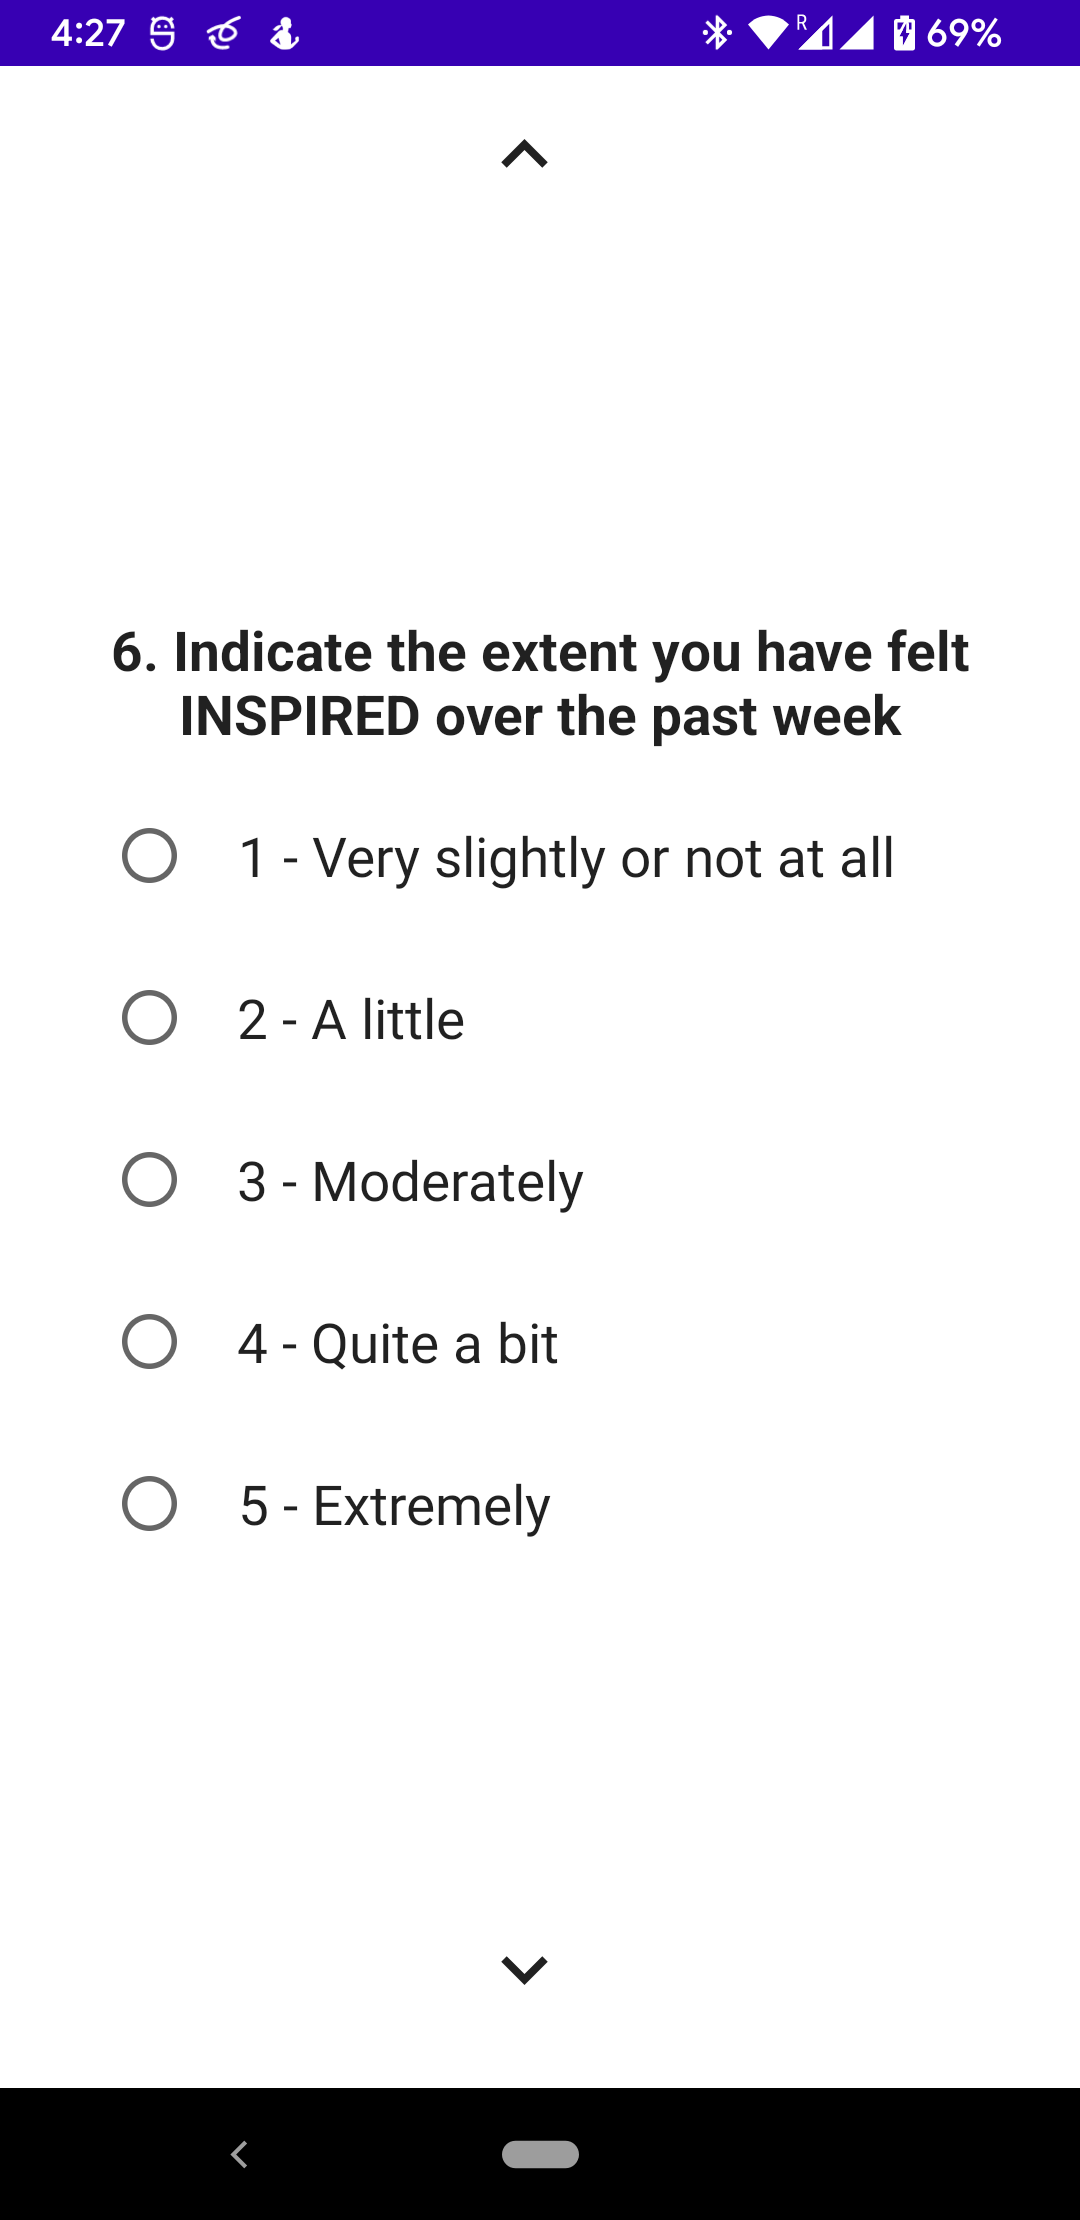
In the last task, the participants were asked to fill in the following surveys presented in the smartphone application:
- GRIT [6],
- PANAS [7],
- HAPPINES [8],
- NFR [9]
Each survey was filled in separately and participants entered each survey via buttons in the main menu. Each survey could be gamified by the addition of simple gamification elements (such as progress tracking and rewards). The volunteers were divided into two groups: group 1 filled in gamified surveys in the first session and non-gamified surveys in the second session, group 2 had the opposite order.
Throughout the whole experiment the physiological signal of participants was captured with three wearable devices: Empatica E4 watch, Samsung Galaxy Watch4 and Muse S (Gen2).
Empatica E4 wristband. It is a wrist-worn top-quality sensor device considered as a Class IIa Medical Device according to CE Crt. No. 1876/MDD (93/42/EEC Directive). The Empatica E4 device measures physiological parameters comprising the Blood Volume Pulse (BVP), from which the Heart Rate Variability (HRV) and the Inter Beat Interval (IBI) are derived as well, the skin temperature (TEMP), the Electrodermal Activity (EDA), and the 3-axis acceleration data (ACC). We used Empatica E4 to record, in the online mode, the BVP (sampling frequency: 64Hz), the EDA (sampling frequency: 4Hz) and the TEMP (sampling frequency: 4Hz).
Samsung Galaxy Watch4. It is a consumer-grade smartwatch with a Wear OS (operating system). We used Samsung Galaxy Watch4 to collect Photoplethysmogram (PPG) signal. This signal can be used to develop tools for the assessment of cognitive load from a consumer-grade wearable and for comparison with the PPG signal collected from the Empatica E4 watch. The signal from Samsung Galaxy Watch4 was a PPG Green signal provided by Samsung Privileged Health SDK [3] with a frequency of 25 Hz.
Muse S EEG headband. An EEG signal is an indirect measurement of neuronal excitatory post-synaptic potentials (EPSP). The propagation of the EPSP through the dendrites generates an electrical field over the scalp measurable by an EEG system through sensors (electrodes) as the difference in electrical potential between two electrodes (one active and the other as reference). For the location of the electrodes, a standardized 10-20 system is used which allows the identification of the brain regions (frontal, central, parietal, temporal, and occipital areas) using a standard nomenclature for the sensors.
The EEG signal is a mixture of oscillations (or brainwaves) characterizing normal brain activity during different brain states (awake, sleep, motor and cognitive task, and so on). There are five typical dominant brain rhythms distinguished by their different frequency ranges. From low to high: Delta (0,5 – 4 Hz), Theta (4 – 7.5 Hz), Alpha (8 – 13 Hz), Beta (14 – 26 Hz), and Gamma (30 - 45 Hz). It is possible to decompose the raw EEG signals (mixture of oscillations) into the different frequency bands through decomposition analysis such as Fast Fourier Transform, Wavelet transform, Welch Power Spectral Density and others.
The Muse S EEG headband is a clinical-grade electroencephalogram suitable to collect brain activity data, inside and outside the laboratory and in the real world. It measures brain activity through dry electrodes placed on the scalp in correspondence with prefrontal (AF7 and AF8 sensors) and temporal (TP9 and TP10 sensors) brain regions, with the Fpz sensor used as a reference electrode at a sampling rate of 256 Hz. The headband is equipped with two extra channels (AUX-right and AUX-left) that can be used for sending other signals to the device, such as trigger signals for the synchronization of videos or auditory stimuli with the EEG recordings, external sensors for measuring heart rate, skin conductance, temperature, audio signals for recording the speech or environmental sounds synchronously with electroencephalography recordings [4].
We recorded the EEG signals using a mobile app (MindMonitor) which allows collecting both raw EEG and processed EEG data (decomposed into the five frequency bands) as well as accelerometer and gyroscope data [5].
Collection procedure. After being informed of the experimental procedure, the participants were asked to sit comfortably in front of the PC monitor used to perform the test. Then, they were provided the participant ID number assigned to them, used to store it in a file as described. After that, the devices were worn as follows: Samsung Galaxy Watch4 on the left wrist, Empatica E4 wristband on the right wrist and Muse headband on the forehead. After checking the quality of the EEG signals (no noise), they were told to perform up to 1 repetition of a set: Stroop test task– baseline – survey. The "tagging" mechanism of the Empatica E4 (pressing the bracelet button) was used to indicate the start and end of each trial.
Data Description
The dataset is divided into two main directories:
- pilot – this folder contains data from 11 volunteers that took part in the pilot study (id 0-10).
- survey_gamification – this directory contains data from 13 volunteers that took part in the survey gamification experiment (id 11-24).
Each of the folders contains subfolders with per participant data. Those subfolders are named after the id of the participant. In the pilot study, participants folders have the following subfolders: baseline, cognitive_load.
baseline – physiological data collected during the relaxation task. It contains the following csv files (which are described in more detail in the description.csv file):
- emaptica_bvp.csv - blood volume pulse (BVP, PPG Green) signal from Empatica E4 Watch,
- empatica_eda.csv - Eda signal from Empatica E4 Watch,
- empatica_temp.csv - body surface temperature from Empatica E4 Watch,
- muse_eeg.csv - EEG data from Muse S headband,
- samsung_bvp.csv - PPG Green signal from Samsung Galaxy Watch4.
cognitive_load – physiological data collected during Stroop task. It contains the following csv files:
- emaptica_bvp.csv,
- empatica_eda.csv,
- empatica_temp.csv,
- muse_eeg.csv
- samsung_bvp.csv,
- stroop_responses.csv - detailed data collected during the Stroop test:
- text - name of the word,
- color - name of the ink the word is printed in,
- stroop_color_match - Stroop color match (1=compatible, 0=incompatible),
- table_row - table row number,
- pressed_key - the pressed key number,
- status - status of the answer (1=correct, 2=wrong, 3=timeout),
- response_speed - response time (milliseconds).
survey_gamification – physiological data and survey answers collected during the survey gamification experiment. This folder is divided into per-patient folders divided into pre and post directories containing data for the first and second experiment sessions, respectively. Pre and post directories contain: baseline and cognitive_load folders described earlier and survey directory with the following csv files:
- emaptica_bvp.csv,
- empatica_eda.csv,
- empatica_temp.csv,
- muse_eeg.csv,
- samsung_bvp.csv,
- questionnaires.csv:
- id - number of the questionnaire,
- Questionnaire - the name of the questionnaire,
- NumQuestions - number of questions in the survey,
- Gamified - yes/no whether a survey is gamified,
- TimeSpent - time spent on answering the survey,
- responses.csv:
- QuestionStartTime - the starting hour of showing the question to the participant,
- SurveyQuestion - the asked question,
- Answer - the selected answer.
Note that Unix time is shifted by a random number of months. Within the single participant folder time samples are shifted by the same value for each measurement device to keep the alignment between signals.
Usage Notes
The data could be used to:
- compare physiological signal captured by wearable devices
- for the development of machine learning models predicting individuals' concentration level.
The former might inform a selection of mobile health intervention supporting technology [12] and the latter might facilitate the development of context-aware notifications and evaluation of user interfaces [11].
We provide code with examples of reading PPG signal from the dataset and building a 1D Convolutional Neural Network for cognitive load estimation at [14].
To check examples of how the dataset can be used, see our paper on cognitive load estimation of gamified and non-gamified mobile application usage [13].
Limitations: The signal captured from participant 11 is incomplete in survey condition (the participant did not fill in the NFR survey). Participants 20 and 21 did not show up on the second round of experiments. There is no folder for subject 19 because this person did not agree to make their data public – we omit this id so that folder names are consistent with our data collection protocol.
Release Notes
Initial release of the data; version: 1.0.0
Ethics
The study was approved by the AGH University of Science and Technology Ethics Committee (IRB number 3/2022). We include data only of subjects who gave written consent to make their data publicly available.
Acknowledgements
This work has been supported by the EU H2020 grant Sano No. 857533 and the IRAP Plus programme of the Foundation for Polish Science. We want to thank Monika Patrycja Lelujko for designing gamification features in the mobile app.
Conflicts of Interest
The authors have no conflict of interest.
References
- Stroop, J. R. (1935). Studies of interference in serial verbal reactions. Journal of experimental psychology, 18(6), 643.
- Stroop task. https://www.psytoolkit.org/experiment-library/stroop.html (Retrieved November 16, 2022)
- Samsung Privileged Health SDK. https://developer.samsung.com/health/privileged (Retrieved November 16, 2022)
- MuseTM EEG-Powered Meditation and Sleep Headband. Muse. https://www.choosemuse.com (Retrieved November 16 2022)
- Mind Monitor. http://mind-monitor.com (Retrieved November 16, 2022)
- Grit Scale. https://angeladuckworth.com/grit-scale/ (Retrieved November 16, 2022)
- Thompson ER. Development and validation of an internationally reliable short-form of the positive and negative affect schedule (PANAS). Journal of cross-cultural psychology. 2007 Mar;38(2):227-42.
- Lyubomirsky S, Lepper HS. Subjective happiness scale. Social Indicators Research. 2020.
- Stevens ML, Crowley P, Garde AH, Mortensen OS, Nygård CH, Holtermann A. Validation of a short-form version of the Danish need for recovery scale against the full scale. International journal of environmental research and public health. 2019 Jul;16(13):2334.
- Seitz, J., & Maedche, A. (2022). Biosignal-Based Recognition of Cognitive Load: A Systematic Review of Public Datasets and Classifiers. Information Systems and Neuroscience: NeuroIS Retreat 2022, 35-52.
- Lisowska, A., Wilk, S. and Peleg, M., 2021, June. Is it a good time to survey you? Cognitive load classification from blood volume pulse. In 2021 IEEE 34th International Symposium on Computer-Based Medical Systems (CBMS) (pp. 137-141). IEEE.
- Lisowska A, Wilk S, Peleg M. SATO (IDEAS expAnded wiTh BCIO): Workflow for designers of patient-centered mobile health behaviour change intervention applications. Journal of Biomedical Informatics. 2022 Dec 28:104276.
- Grzeszczyk, M, K., Adamczyk, P., Marek, S., Pręcikowski, R., Kuś, M., Lelujko, M. P., Blanco, R., Trzciński, T., Sitek, A., Malawski, M., and Lisowska A. (2023). Can gamification reduce the burden of self-reporting in mHealth applications? Feasibility study using machine learning from smartwatch data to estimate cognitive load. arXiv preprint arXiv:2302.03616 (2023)
- CogWear GitHub repository. https://github.com/SanoScience/CogWear (Retrieved February 6, 2023)
Access
Access Policy:
Anyone can access the files, as long as they conform to the terms of the specified license.
License (for files):
Open Data Commons Open Database License v1.0
Discovery
DOI (version 1.0.0):
https://doi.org/10.13026/5f6t-b637
DOI (latest version):
https://doi.org/10.13026/21mx-7p04
Corresponding Author
Files
Total uncompressed size: 2.7 GB.
Access the files
- Download the ZIP file (179.2 MB)
-
Download the files using your terminal:
wget -r -N -c -np https://physionet.org/files/consumer-grade-wearables/1.0.0/
| Name | Size | Modified |
|---|---|---|
| pilot | ||
| survey_gamification | ||
| LICENSE.txt (download) | 25.2 KB | 2023-03-08 |
| README.md (download) | 2.3 KB | 2022-11-22 |
| SHA256SUMS.txt (download) | 61.5 KB | 2023-03-31 |
| description.csv (download) | 2.0 KB | 2023-02-27 |
| example_gamified.png (download) | 120.9 KB | 2022-11-22 |
| example_non_gamified.png (download) | 86.9 KB | 2022-11-22 |