Challenge Open Access
Predicting Mortality of ICU Patients: The PhysioNet/Computing in Cardiology Challenge 2012
Ikaro Silva , George Moody , Roger Mark , Leo Anthony Celi
Published: Jan. 20, 2012. Version: 1.0.0
Community forum for the 2012 PhysioNet/CinC Challenge (Sept. 1, 2012, 2:40 p.m.)
If you have any questions or comments regarding this challenge, please post it directly in our Community Discussion Forum. This will increase transparency (benefiting all the competitors) and ensure that all the challenge organizers see your question.
Final scores in the PhysioNet/CinC Challenge 2012 (Aug. 31, 2012, 12:45 a.m.)
Final scores in the PhysioNet/CinC Challenge 2012 have now been posted. Participants will present their work on the challenge, which focuses on predicting mortality of ICU patients, at CinC 2012 in Krakow, 9-12 September.
More news
Submit a Phase 2 Challenge Entry Now (June 4, 2012, 6:40 p.m.)
Phase 2 of the PhysioNet/Computing in Cardiology Challenge 2012 (Predicting mortality of ICU patients) is now open, and participants may submit entries until 25 August. If you missed Phase 1, you are still welcome to participate unofficially in Phase 2.
Submit a prelminary Challenge Entry (closed 25 April) (March 27, 2012, 2 a.m.)
Registration for the PhysioNet/Computing in Cardiology Challenge 2012 is now open, and registered participants may submit entries. This year's challenge focuses on predicting mortality of ICU patients. Submit a preliminary entry by 25 April.
PhysioNet/Computing in Cardiology Challenge 2012 Opens (Jan. 20, 2012, 9 p.m.)
This year's challenge focuses on methods for predicting ICU mortality, using a rich set of physiologic and clinical variables collected from 12,000 patients.
Please include the standard citation for PhysioNet:
(show more options)
Goldberger, A., Amaral, L., Glass, L., Hausdorff, J., Ivanov, P. C., Mark, R., ... & Stanley, H. E. (2000). PhysioBank, PhysioToolkit, and PhysioNet: Components of a new research resource for complex physiologic signals. Circulation [Online]. 101 (23), pp. e215–e220. RRID:SCR_007345.
Introduction
The development of methods for prediction of mortality rates in Intensive Care Unit (ICU) populations has been motivated primarily by the need to compare the efficacy of medications, care guidelines, surgery, and other interventions when, as is common, it is necessary to control for differences in severity of illness or trauma, age, and other factors. For example, comparing overall mortality rates between trauma units in a community hospital, a teaching hospital, and a military field hospital is likely to reflect the differences in the patient populations more than any differences in standards of care. Acuity scores such as APACHE and SAPS-II are widely used to account for these differences in the context of such studies.
By contrast, the focus of the PhysioNet/CinC Challenge 2012 is to develop methods for patient-specific prediction of in-hospital mortality. Participants will use information collected during the first two days of an ICU stay to predict which patients survive their hospitalizations, and which patients do not.
Data for the Challenge
The data used for the challenge consist of records from 12,000 ICU stays. All patients were adults who were admitted for a wide variety of reasons to cardiac, medical, surgical, and trauma ICUs. ICU stays of less than 48 hours have been excluded. Patients with DNR (do not resuscitate) or CMO (comfort measures only) directives were not excluded.
Four thousand records comprise training set A, and the remaining records form test sets B and C. Outcomes are provided for the training set records, and are withheld for the test set records.
Up to 42 variables were recorded at least once during the first 48 hours after admission to the ICU. Not all variables are available in all cases, however. Six of these variables are general descriptors (collected on admission), and the remainder are time series, for which multiple observations may be available.
Each observation has an associated time-stamp indicating the elapsed time of the observation since ICU admission in each case, in hours and minutes. Thus, for example, a time stamp of 35:19 means that the associated observation was made 35 hours and 19 minutes after the patient was admitted to the ICU.
Each record is stored as a comma-separated value (CSV) text file. To simplify downloading, participants may download a zip file or tarball containing all of training set A or test set B. Test set C will be used for validation only and will not be made available to participants.
Update (8 May 2012): The extraneous ages that were present in the previous versions of some data files have been removed, and a new general descriptor (ICUType, see below) has been added in each data file.
Five additional outcome-related descriptors, described below, are known for each record. These are stored in separate CSV text files for each of sets A, B, and C, but only those for set A are available to challenge participants.
All valid values for general descriptors, time series variables, and outcome-related descriptors are non-negative (≥ 0). A value of -1 indicates missing or unknown data (for example, if a patient's height was not recorded).
General Descriptors
As noted, these six descriptors are collected at the time the patient is admitted to the ICU. Their associated time-stamps are set to 00:00 (thus they appear at the beginning of each patient's record).
- RecordID (a unique integer for each ICU stay)
- Age (years)
- Gender (0: female, or 1: male)
- Height (cm)
- ICUType (1: Coronary Care Unit, 2: Cardiac Surgery Recovery Unit,
- 3: Medical ICU, or 4: Surgical ICU)
- Weight (kg)*.
The ICUType was added for use in Phase 2; it specifies the type of ICU to which the patient has been admitted.
Time Series
These 37 variables may be observed once, more than once, or not at all in some cases:
|
|
|
The time series measurements are recorded in chronological order within each record, and the associated time stamps indicate the elapsed time since admission to the ICU. Measurements may be recorded at regular intervals ranging from hourly to daily, or at irregular intervals as required. Not all time series are available in all cases.
In a few cases, such as blood pressure, different measurements made using two or more methods or sensors may be recorded with the same or only slightly different time-stamps. Occasional outliers should be expected as well.
* Note that Weight is both a general descriptor (recorded on admission) and a time series variable (often measured hourly, for estimating fluid balance).
Outcome-related Descriptors
The outcome-related descriptors are kept in a separate CSV text file for each of the three record sets; as noted, only the file associated with training set A is available to participants. Each line of the outcomes file contains these descriptors:
- RecordID (defined as above)
- SAPS-I score (Le Gall et al., 1984)
- SOFA score (Ferreira et al., 2001)
- Length of stay (days)
- Survival (days)
- In-hospital death (0: survivor, or 1: died in-hospital)
The Length of stay is the number of days between the patient's admission to the ICU and the end of hospitalization (including any time spent in the hospital after discharge from the ICU). If the patient's death was recorded (in or out of hospital), then Survival is the number of days between ICU admission and death; otherwise, Survival is assigned the value -1. Since patients who spent less than 48 hours in the ICU have been excluded, Length of stay and Survival never have the values 0 or 1 in the challenge data sets. Given these definitions and constraints,
Survival > Length of stay ⇒ Survivor
Survival = -1 ⇒ Survivor
2 ≤ Survival ≤ Length of stay ⇒ In-hospital death
Entering the Challenge
To begin, we recommend studying the training set as preparation for the Challenge itself. In particular, note that the SAPS-I score can be calculated readily from the time series, as the sample entries below do. To succeed in the Challenge, you should aim to outperform the sample entries (see Software below).
All entries in the Challenge must be in the form of source code that analyses a single Challenge record, producing a prediction (0: survival, or 1: in-hospital death) and an estimate of the risk of death (as a number between 0 and 1, where 0 is certain survival and 1 is certain death).
Your entry may be written in portable (ANSI/ISO) C or MATLAB/Octave m-code; other languages, such as Java, Perl, and R, may be acceptable (see special requirements for entries in other languages below), but please ask us first, and do so no later than 7 April 2012. Entries must accept properly-formatted input and produce properly-formatted output, either as physionet2012.m does (if written in m-code), or as physionet2012.c does (otherwise).
Acceptable entries are evaluated and scored by PhysioNet using an automated test framework, two versions of which are also available to participants for testing their entries unofficially prior to submitting them. The framework starts execution of an entry, supplies data from a single Challenge record, and collects the entry's analysis for that record; this process is a "run". The framework performs a separate run for each of the 4000 records in set B or set C.
Entries will be restarted for each run (each test record); they may not store information for use in later runs (for example, by writing files to be read later, or, in MATLAB entries, by setting global variables). Entries may include files that may be read but not modified during the test.
Awards will be presented to the most successful eligible participants during Computing in Cardiology (CinC) 2012. To be eligible for an award, you must:
- Submit a preliminary Challenge entry via PhysioNet no later than 25 April 2012. (The period before this deadline is Phase 1.) You may submit up to five Phase 1 entries before this deadline. (Use them or lose them!) Each entry will receive scores for set B.
- Submit an acceptable abstract on your work on the Challenge to Computing in Cardiology no later than 1 May 2012. Include a pair of set B scores for at least one preliminary entry in your abstract. Please select "PhysioNet/CinC Challenge" as the topic of your abstract, so it can be identified easily by the abstract review committee.
- Submit a final Challenge entry via PhysioNet during Phase 2 (on or after 1 June but no later than 25 August 2012). You may submit up to five Phase 2 entries between 26 April and 25 August. Each entry will receive scores for set B.
- Select one of your previously submitted Phase 1 or Phase 2 entries for testing using set C. If you have not made a choice before 26 August 2012, we will test the entry that received the best event 1 score for set B. The set C scores will determine the final rankings of the entries, with the top-ranked entries in each event eligible for awards.
- Submit a full (4-page) paper on your work on the Challenge to CinC no later than 1 September 2012.
- Attend CinC 2012 (9-12 September 2012, in Krakow, Poland) and present your work there.
An important goal of this Challenge, and of others in the annual series of PhysioNet/CinC Challenges, is to accelerate progress on the Challenge questions, not only during the limited period of the Challenge, but also afterward. In pursuit of this goal, we strongly encourage participants to submit open-source entries that will be made freely available after the conclusion of the Challenge via PhysioNet. If your entry is not intended as an open-source entry, please state this clearly within its first few lines.
Eligible authors of the entries that receive the best set C scores in each Challenge event will receive award certificates during the closing plenary session of CinC on 12 September 2012. In recognition of their contributions to further work on the Challenge problem, eligible authors of the open-source entries that receive the best set C scores will also receive monetary awards. No team or individual will receive more than one such monetary award.
Sample entries, test frameworks, and sample results
We have provided sample entries written in MATLAB m-code and in C, test frameworks that can be used for batch-processing a set of Challenge data using a sample entry or your own entry, code for calculating unofficial scores, as well as the outputs of the sample entries for set A. Use this software to test your entry before submitting it, to verify that it can accept properly-formatted input and produce properly-formatted output. If you wish, you may incorporate code from the sample entries within your own entry, but you will have to add something of your own creation in order to succeed in the Challenge!
Participants may find the MATLAB and C functions for calculating SAPS-I scores to be useful. The calculated SAPS scores do not always match those given in the outcomes file, however.
For participants developing entries using MATLAB:
A valid entry written in m-code must be a function named physionet2012, with this signature:
[risk,prediction]=physionet2012(time,param,value)
The function must be able to run this way within the test framework, genresults.m (below), on a 64-bit GNU/Linux platform running MATLAB R2010b (or a later version). See genresults.m for definitions of the input and output variables. With prior approval, your entry may use most MATLAB toolboxes.
- physionet2012.m
- Sample Challenge entry (requires saps_score.m below, and the MATLAB statistics toolbox)
- saps_score.m
- MATLAB function to calculate SAPS I score
- genresults.m
- Test framework for MATLAB m-code entries. This code can also calculate (unofficial) scores for set A; to do so, you will need the known outcomes (Outcomes-a.txt, above) and lemeshow.m (below).
- lemeshow.m
- MATLAB function for calculating unofficial event 2 scores
- Sample-SetA.txt
- Output of physionet2012.m for training set A, as collected by genresults.m
Scores calculated by lemeshow.m may differ slightly from the official scores (calculated using score.c, below) due to differences in rounding. Scores calculated by score.c will be used to determine the final rankings.
For participants developing entries using C or (with prior approval) another language:
A valid entry written in any language other than m-code must be provided in source form with instructions (a commented Makefile would be ideal) for producing an executable program named physionet2012 from the source file(s). The executable program must be able to run in this way within the test framework on a 64-bit GNU/Linux platform:
physionet2012 <input-file >output-file
i.e, reading the contents of input-file (a Challenge data file such as set-b/142675.txt) from its standard input, and writing its analysis of the input to its standard output, as a single newline-terminated line in this format:
142675,0,0.123
where the three fields are the RecordID, the binary prediction, and the risk estimate, as described below.
- physionet2012.c
- C source for a sample Challenge entry (must be compiled together with saps_score.c below)
- saps_score.c
- C source for a function to calculate SAPS I score
- genresults.sh
- Test framework for entries not written in m-code; requires a shell (command-line interpreter) such as sh or bash. This code can also calculate (unofficial) scores for set A; to do so, you will need the known outcomes (Outcomes-a.txt, above) and a compiled version of score.c (below).
- score.c
- C source for a program for calculating event 1 and event 2 scores
- plotresults.sh
- Shell script for generating a risk decile plot as shown below (requires plt and ImageMagick)
- Outputs-a.txt
- Output of physionet2012.c for training set A, as collected by genresults.sh
- results-a-c.png
- Output of plotresults.sh for physionet2012.c evaluated on set A
For participants developing entries in R:
Download the sample R entry (physionet2012.R) and the first data file from set A (132539.txt) into your working directory, then test the sample R entry by running it using Rscript, like this:
Rscript physionet2012.R <132539.txt >output.txt
This creates an output file output.txt, containing one line:
132539,0,0.5
The sample R entry doesn't analyze the input; it simply reads it and produces a correctly-formatted output line. Use physionet2012.R as a model for your R-code. You can test your entry on set A using genresults.sh if you replace this line in it:
./physionet2012 <$R >>$OUT
with this one:
Rscript physionet2012.R <$R >>$OUT
Challenge Scoring
As in previous challenges, participants may compete in multiple events:
Entries must output both predictions and risk estimates, but if you do not wish to compete in one of the two events your entry may output any acceptable values for that event.
Scoring for Event 1 is based on 2 metrics: Sensitivity (Se) and positive predictivity(+P). We define the numbers of true positives (TP), false positives (FP), false negatives (FN), and true negatives (TN) as below:
| Outcome | Observed | ||
| Death | Survivor | ||
| Predicted | Death | TP | FP |
| Survivor | FN | TN | |
Using these definitions, the 2 metrics and the scoring for Event 1 are given by:
| Se = TP / (TP + FN) | [the fraction of in-hospital deaths that are predicted] |
| +P = TP / (TP + FP) | [the fraction of correct predictions of in-hospital deaths] |
| Score1 = min(Se,+P) | [the minimum of Sensitivity and positive predictivity] |
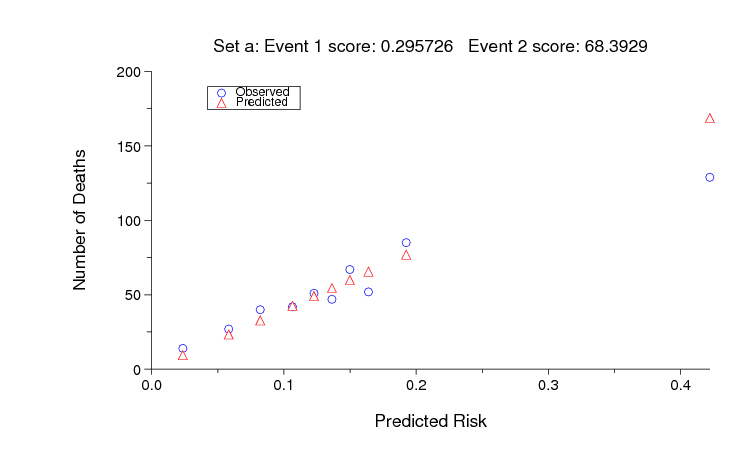
The sample MATLAB entry based on SAPS-1 earns an unofficial Event 1 score of 0.296 on set A, whereas random guessing yields a score of 0.139. A perfect (and almost certainly unattainable) Event 1 score is 1, so there is much room for improvement on the sample entry.
Scoring for Event 2 is based on the Hosmer-Lemeshow H statistic (a common measure of model calibration), and on the spread, D, of risk estimates.
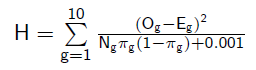
To calculate the H statistic for a given entry, the in-hospital mortality risks predicted by that entry are first sorted and the corresponding records are binned into deciles designated by g = 1,2,3...10. Thus the first decile (g = 1) of the 4000-record set B contains the 400 records with the lowest predicted risk, the second decile contains the next 400 records, etc. The H statistic is then calculated as:
where for each decile g, Og is the observed number of in-hospital deaths, Eg is the predicted number of deaths, Ng is the number of records (400), and πg is the mean estimated risk for records in the decile. This definition is modified as shown with respect to the standard definition of H by the addition of 0.001 in the denominator; we do this to avoid division by zero if πg is zero or one. This can occur if an entry estimates a risk of zero (or one) for 400 or more records in a set; the effect of doing so, regardless of accuracy, will cause a substantial increase in H (lower values are better), so we strongly recommend not allowing your entry to output risk values below about 0.01 or above about 0.99.
To be useful as input to medical decisions for individual patients, risk estimates should accurately reflect individual patient risks, rather than simply the risk for the entire population of patients. For this reason, the event 2 score is also based on the range of risks, specifically on the difference, D, between the mean risk estimates in the top and bottom deciles from the H calculation (π10-π1). The event 2 score is thus the range-normalized H statistic, defined as H/D.
Files lemeshow.m (in Octave/MATLAB m-code) and score.c (in C) define functions that calculate H/D as defined above.
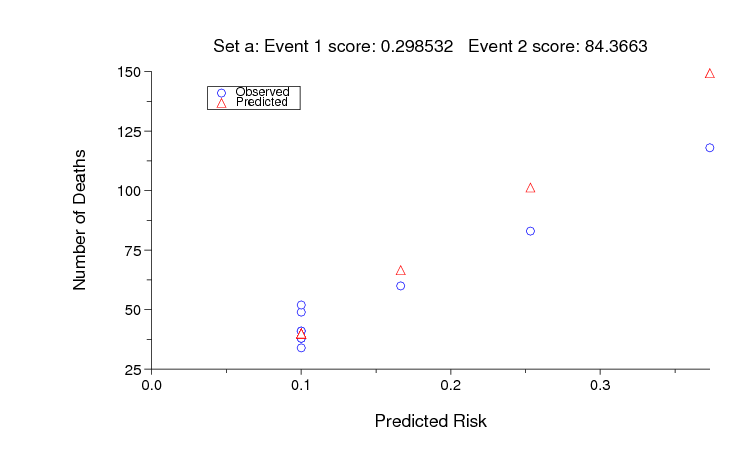
The sample MATLAB entry based on SAPS-1 achieves an unofficial Event 2 score of 68 on set A, and random guessing scores 9666. As for Event 1, an ideal score (0 in this case) is almost certainly unattainable, but it should be possible to improve on the sample entry. The figure below shows the observed and predicted numbers of deaths for each decile of risk assigned by the sample MATLAB entry for set A.
Frequently asked questions about the Challenge
Can I submit an entry written in ...?
We would really like to say yes! What will determine our answer is whether it is practical and reasonably efficient for us to evaluate your entry, and you can help us by testing and documenting the procedure needed to do so thoroughly.
If you can show us how to run your entry in an unmodified copy of our test framework for entries written in C, using only compilers, interpreters, libraries, and other standard components that are freely available for GNU/Linux, we encourage you to submit code written in the language of your choice. We will accept entries written in Java, Perl, or R under these conditions, and (if you ask nicely) we will consider adding other languages to this short list.
Please give us as much extra time as possible to review entries not written in C or m-code.
Would it still be possible to participate if we send you code that is compiled and tested to run on the destination hardware and OS?
Sorry, no. We do not require participants to submit open-source entries, but we will not test executables that we have not compiled ourselves from source code that we have inspected.
If I don't submit all 5 preliminary (Phase 1) entries, can I add the unused ones to my quota of 5 Phase 2 entries?
No. We are trying to encourage both experimentation with multiple approaches and sustained effort. In past Challenges some participants have used their entire allowance of entries before the first deadline, and others have saved their entries until hours before the final deadline. The most successful participants have usually reflected on each set of results, refining their ideas (and not merely their decision thresholds) before submitting the next entry. This approach yields better results, and it also allows us to review your entries and provide scores more rapidly than if we receive a large fraction of them just before the deadlines.
Will it be possible to outperform the sample entries based on SAPS-I?
Yes, certainly. SAPS-I uses fewer than half of the variables provided in the Challenge data sets, and only the first half (24 of 48 hours) of those. There is plenty of room for improvement in both events.
Why are the scores for the C and m-code sample entries different?
The scores are different because the two sample entries are not exactly the same algorithm. The SAPS calculations are very similar, but the C version makes use of data with time stamp of '24:00' (i.e., exactly 24 hours from the start) and the m-code version stops at '23:59'. This accounts for the very slight difference in the event 1 scores even though both entries use the same decision threshold. The risk estimates (which determine the event 2 scores) are completely different; the m-code entry uses a function that was fitted to the observed distribution of risk in set A, and the C entry uses a lookup table that is not optimized at all.
Why didn't you choose [my favorite statistic] as a scoring metric?
Fund another award and we will consider adding another event!
No single measure can summarize all of the important aspects of performance on the Challenge problem in a single number; that's why we have multiple events. Since scoring metrics inevitably influence how participants design and refine their entries, we have chosen metrics that provide incentives to make useful predictions. Many alternatives would reward trivial and clinically irrelevant strategies; for example, one can obtain a high overall accuracy by predicting that all patients will survive, but such a predictor is of no value whatsoever.
What is the precise deadline for Phase 1? What happens if I can't figure out how to submit a valid entry by then?
On the off-chance that someone on Baker or Howard Islands in the mid-Pacific, or on a ship at sea between longitudes 172.5° W and 180°, submits an entry just before midnight local time on 25 April, and in order to be fair to everyone else, the deadline for phase 1 was noon GMT on 26 April; at that time, the software that collects entries stopped doing so.
The deadline is one of several that are important if you would like to be eligible for the Challenge awards (see above). Anyone who wishes to participate without eligibility for awards is welcome to join in unofficially during Phase 2 (1 June through 25 August).
Suggested readings on acuity scores and mortality prediction
- APACHE (1981)
- Knaus WA, Zimmerman JE, Wagner DP, Draper EA, Lawrence DE. APACHE - acute physiology and chronic health evaluation: A physiologically based classification system. Critical Care Medicine 9(8):591-597 (1981 Aug).
- SAPS-I (1984)
- Le Gall JR, Loirat P, Alperovitch A, Glaser P, Granthil C, Mathieu D, Mercier P, Thomas R, Villers D. A simplified acute physiology score for ICU patients. Critical Care Medicine 12(11):975-977 (1984 Nov).
- MPM-I (1985)
- Lemeshow S, Teres D, Pastides H, Avrunin JS, Steingrub JS. A method for predicting survival and mortality of ICU patients using objectively derived weights. Critical Care Medicine 13(7):519-525 (1985 Jul).
- APACHE II (1985)
- Knaus WA, Draper EA, Wagner DP, Zimmerman JE. APACHE II: a severity of disease classification system. Critical Care Medicine 13(10):818-29 (1985 Oct).
- APACHE III (1991)
- Knaus WA, Wagner DP, Draper EA, Zimmerman JE, Bergner M, Bastos PG, Sirio CA, Murphy DJ, Lotring T, Damiano A, et al. The APACHE III prognostic system. Risk prediction of hospital mortality for critically ill hospitalized adults. Chest 100(6):1619-1636 (1991 Dec).
- MPM II (1993)
- Lemeshow S, Teres D, Klar J, Avrunin JS, Gehlbach SH, Rapoport J. Mortality Probability Models (MPM II) based on an international cohort of intensive care unit patients. JAMA 270(20):2478-86 (1993 Nov 24).
- SAPS-II (1993)
- Le Gall JR, Lemeshow S, Saulnier F. A new simplified acute physiology score (SAPS II) based on a European/North American multicenter study. JAMA 270(24):2957-2963 (1993 Dec 22-29).
- Elixhauser Comorbidity Index (1998)
- Elixhauser A, Steiner C, Harris DR, Coffey RM. Comorbidity measures for use with administrative data. Med Care 36(1):8-27 (1998 Jan).
- SOFA (2001)
- Ferreira, FL, Bota DP, Bross A, Mélot C, Vincent JL. Serial evaluation of the SOFA score to predict outcome in critically ill patients. JAMA 286(14):1754-1758 (2001 Oct 10).
- SAPS 3 (2005)
- Metnitz PGH, Moreno RP, Almeida E, Jordan B, Bauer P, Abizanda Campos R, Iapichino G, Edbrooke D, Capuzzo M, Le Gall JR. SAPS 3—From evaluation of the patient to evaluation of the intensive care unit. Part 1: Objectives, methods and cohort description. Intensive Care Med 31:1336-1344 (2005).
Moreno RP, Metnitz PGH, Almeida E, Jordan B, Bauer P, Abizanda Campos R, Iapichino G, Edbrooke D, Capuzzo M, Le Gall JR. SAPS 3—From evaluation of the patient to evaluation of the intensive care unit. Part 2: Development of a prognostic model for hospital mortality at ICU admission. Intensive Care Med 31:1345-1355 (2005). - [Event-based method] (2006)
- Silva A, Cortez P, Santos MF, Gomes L, Neves J. Mortality assessment in intensive care units via adverse events using artificial neural networks. Artificial Intelligence in Medicine 36(3):223-234 (2006 Mar).
- APACHE IV (2006)
- Zimmerman JE, Kramer AA, McNair DS, Malila FM. Acute Physiology and Chronic Health Evaluation (APACHE) IV: hospital mortality assessment for today's critically ill patients. Critical Care Medicine 34(5):1297-310 (2006 May).
- MPM0-III (2007)
- Higgins TL, Teres D, Copes WS, Nathanson BH, Stark M, Kramer AA. Assessing contemporary intensive care unit outcome: an updated Mortality Probability Admission Model (MPM0-III). Critical Care Medicine 35(3):827-835 (2007 Mar).
- [Real-time method] (2009)
- Hug CW, Szolovits P. ICU Acuity: Real-time models versus daily models. AMIA Annual Symposium Proceedings, 260-264 (2009).
- Event 1
- The goal is to predict in-hospital mortality with the greatest accuracy using a binary classifier. For this event, your entry must output a prediction (0: survival, or 1: in-hospital death) for each patient.
- Event 2
- The goal is to predict in-hospital mortality percentage (risk) within each decile range with the greatest accuracy. For this event, your entry must output a risk estimate between 0 and 1 for each patient.
Challenge Results
Following the final deadline for submission of entries on 25 August 2012, each participant selected (or allowed the organizers to select) a previously submitted entry to be evaluated using Challenge test set C, which was used for validation only and not made available to participants. Scores obtained in the set C evaluations determined the final ranks shown below.
Event 1 (binary prediction of survival or in-hospital death)
| Participant | Score |
|---|---|
| Alistair Johnson, Nic Dunkley, Louis Mayaud, Athanasios Tsanas, Andrew Kramer, Gari Clifford | 0.5353 |
| Luca Citi, Riccardo Barbieri | 0.5345 |
| Srinivasan Vairavan, Larry Eshelman, Syed Haider, Abigail Flower, Adam Seiver | 0.5009 |
| Martin Macas, Michal Huptych, Jakub Kuzilek | 0.4928 |
| Henian Xia, Brian Daley, Adam Petrie, Xiaopeng Zhao | 0.4923 |
| Steven L Hamilton, James R Hamilton | 0.4872 |
| Natalia M Arzeno, Joyce C Ho, Cheng H Lee | 0.4821 |
| Chih-Chun Chia, Gyemin Lee, Zahi Karam, Alexander Van Esbroeck, Sean McMillan, Ilan Rubinfeld, Zeeshan Syed | 0.4564 |
| Alexandros Pantelopoulos | 0.4544 |
| Deep Bera, Mithun Manjnath Nayak | 0.4513 |
| Sample and random predictors | |
| SAPS-I (in m-code) | 0.3125 |
| SAPS-I (in C) | 0.3097 |
| 86% randomly predicted to survive | 0.1386 |
The top 10 (of 28) participants in event 1 are listed above. The score is the smaller of sensitivity (the fraction of in-hospital deaths that are predicted) and positive predictivity (the fraction of predictions of in-hospital deaths that are correct). The range is 0 (worst) to 1 (ideal).
Event 2 (estimation of in-hospital mortality risk)
| Participant | Score |
|---|---|
| Luca Citi, Riccardo Barbieri | 17.88 |
| Tongbi Kang, Yilun Su, Lianying Ji | 20.58 |
| Martin Macas, Michal Huptych, Jakub Kuzilek | 24.70 |
| Chidube Ezeozue | 24.93 |
| Alistair Johnson, Nic Dunkley, Louis Mayaud, Athanasios Tsanas, Andrew Kramer, Gari Clifford | 29.86 |
| Mehmet Kayaalp | 36.38 |
| Tom Pollard, Demetrio Martinez | 38.23 |
| Deep Bera, Mithun Manjnath Nayak | 45.01 |
| Antonio Bosnjak, Guillermo Montilla | 48.61 |
| Natalia M Arzeno, Joyce C Ho, Cheng H Lee | 51.69 |
| Sample and random predictors | |
| SAPS-I (in m-code) | 68.58 |
| SAPS-I (in C) | 35.21 |
| 86% randomly predicted to survive | 10137.7 |
The top 10 (of 23) participants in event 2 are listed above; 5 participants in event 1 did not enter event 2. The score is a range-normalized Hosmer-Lemeshow H statistic, which approaches an ideal value of 0 as risk is estimated more accurately and over a broader range; see Challenge scoring for details.
Papers
The following paper is an introduction to the challenge topic, with a summary of the challenge results and a discussion of their implications. Please cite this publication when referencing the Challenge.
Predicting In-Hospital Mortality of Patients in ICU: The PhysioNet/Computing in Cardiology Challenge 2012
Ikaro Silva, George Moody, Daniel J Scott, Leo A Celi, Roger G Mark
Participants in the Challenge presented their work at Computers in Cardiology 2012. The papers have been made available by their authors under the terms of the Creative Commons Attribution License 3.0 (CCAL). See this page for a list of the papers. We wish to thank all of the authors for their contributions.
Access
Access Policy:
Anyone can access the files, as long as they conform to the terms of the specified license.
License (for files):
Open Data Commons Attribution License v1.0
Discovery
Topics:
mortality
prediction
challenge
ehr
mimic
Project Views
1429
Current Version1429
All VersionsCorresponding Author
Versions
Files
Access the files
- Download the ZIP file (1.8 GB)
-
Download the files using your terminal:
wget -r -N -c -np https://physionet.org/files/challenge-2012/1.0.0/
-
Download the files using AWS command line tools:
aws s3 sync --no-sign-request s3://physionet-open/challenge-2012/1.0.0/ DESTINATION