Database Open Access
Long-term Recordings of Gait Dynamics
Published: Aug. 16, 2001. Version: 1.0.0
Please include the standard citation for PhysioNet:
(show more options)
Pollard, T., Moody, B. E., Lehman, L., Gow, B., Fernandes, C., Xie, C., Johnson, A., Mark, R. G., & Heldt, T. (2026). PhysioNet as a global platform for biomedical research. Nature Health. https://doi.org/10.1038/s44360-026-00096-z. Available from: https://rdcu.be/faatM
Unconstrained and Metronomic Walking
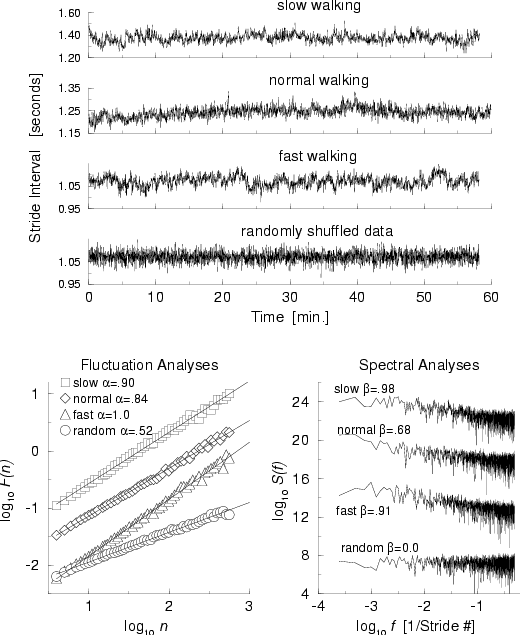
Fractal dynamics were recently detected in the apparently “noisy” variations in the stride interval of human walking. Dynamical analysis of these step-to-step fluctuations revealed a self-similar pattern: fluctuations at one time scale are statistically similar to those at multiple other time scales, at least over hundreds of steps, while healthy subjects walk at their normal rate. To study the stability of this fractal property, we analyzed data obtained from ten healthy subjects who walked for 1 hour at their usual, slow and fast paces. The stride interval fluctuations exhibited long-range correlations with power-law decay for up to a thousand strides at all three walking rates. In contrast, during metronomically-paced walking, these long-range correlations disappeared; variations in the stride interval were anti-correlated. The long-range correlations observed during spontaneous walking were not affected by removal of drifts in the time series. Thus, the fractal dynamics of spontaneous stride interval are normally quite robust and intrinsic to the locomotor system. Furthermore, this fractal property of neural output may be related to the higher nervous centers responsible for control of walking rhythm.
Stride interval fluctuations were studied in ten young, healthy men. Participants had no history of any neuromuscular, respiratory or cardiovascular disorders, and were taking no medications. Mean age was 21.7 years (range: 18-29 years). Height was 1.77 ± 0.08 meters (mean ± S.D.) and weight was 71.8 ± 10.7 kg. All subjects provided informed written consent.
Subjects walked continuously on level ground around an obstacle free, long (either 225 or 400 meters), approximately oval path and the stride interval was measured using ultra-thin, force sensitive switches taped inside one shoe. For more details, please see the accompanying publication.
Each subject was given an arbitrary id (si01, si02, ... si10). For each subject, there are six data files: normal (.norm), slow (.slow) and fast (.fast) walking for 1 hour each as well as walking in time to a metronome at normal (.metnrm), slow (.metslw) and fast (.metfst) paces.
We find robust long-range correlations during unconstrained walking at all three walking rates and anti-correlations during metronomic walking. What do you find? Are there other rate or condition dependent effects on the histogram or the dynamics?
Contact
Hausdorff JM et al. Fractal dynamics of human gait: stability of long-range correlations in stride interval fluctuations. J Appl Physiol 80:1448-1457, 1996.
or contact Jeff Hausdorff.
Access
Access Policy:
Anyone can access the files, as long as they conform to the terms of the specified license.
License (for files):
Open Data Commons Attribution License v1.0
Discovery
DOI (version 1.0.0):
https://doi.org/10.13026/C28679
Topics:
gait
Project Views
151
Current Version151
All VersionsCorresponding Author
Versions
Files
Total uncompressed size: 1.1 MB.
Access the files
- Download the ZIP file (1.1 MB)
-
Download the files using your terminal:
wget -r -N -c -np https://physionet.org/files/umwdb/1.0.0/
-
Download the files using AWS command line tools:
aws s3 sync --no-sign-request s3://physionet-open/umwdb/1.0.0/ DESTINATION
| Name | Size | Modified |
|---|---|---|
| SHA256SUMS.txt (download) | 4.6 KB | 2019-02-20 |
| fig.png (download) | 36.6 KB | 2001-08-16 |
| fig.ps (download) | 280.9 KB | 2001-08-16 |
| si01.fast (download) | 21.1 KB | 2001-01-17 |
| si01.metfst (download) | 10.6 KB | 2001-01-17 |
| si01.metnrm (download) | 9.7 KB | 2001-01-17 |
| si01.metslw (download) | 8.8 KB | 2001-01-17 |
| si01.norm (download) | 19.8 KB | 2001-01-17 |
| si01.slow (download) | 19.4 KB | 2001-01-17 |
| si02.fast (download) | 22.4 KB | 2001-01-17 |
| si02.metfst (download) | 10.4 KB | 2001-01-17 |
| si02.metnrm (download) | 10.5 KB | 2001-01-17 |
| si02.metslw (download) | 10.0 KB | 2001-01-17 |
| si02.norm (download) | 19.7 KB | 2001-01-17 |
| si02.slow (download) | 19.6 KB | 2001-01-17 |
| si03.fast (download) | 19.1 KB | 2001-01-17 |
| si03.metfst (download) | 11.1 KB | 2001-01-17 |
| si03.metnrm (download) | 9.7 KB | 2001-01-17 |
| si03.metslw (download) | 8.0 KB | 2001-01-17 |
| si03.norm (download) | 19.9 KB | 2001-01-17 |
| si03.slow (download) | 20.6 KB | 2001-01-17 |
| si04.fast (download) | 20.7 KB | 2001-01-17 |
| si04.metfst (download) | 10.8 KB | 2001-01-17 |
| si04.metnrm (download) | 10.0 KB | 2001-01-17 |
| si04.metslw (download) | 8.3 KB | 2001-01-17 |
| si04.norm (download) | 18.3 KB | 2001-01-17 |
| si04.slow (download) | 15.4 KB | 2001-01-17 |
| si05.fast (download) | 22.4 KB | 2001-01-17 |
| si05.metfst (download) | 11.5 KB | 2001-01-17 |
| si05.metnrm (download) | 9.3 KB | 2001-01-17 |
| si05.metslw (download) | 7.7 KB | 2001-01-17 |
| si05.norm (download) | 19.7 KB | 2001-01-17 |
| si05.slow (download) | 14.6 KB | 2001-01-17 |
| si06.fast (download) | 20.2 KB | 2001-01-17 |
| si06.metfst (download) | 8.4 KB | 2001-01-17 |
| si06.metnrm (download) | 9.6 KB | 2001-01-17 |
| si06.metslw (download) | 10.3 KB | 2001-01-17 |
| si06.norm (download) | 19.3 KB | 2001-01-17 |
| si06.slow (download) | 16.7 KB | 2001-01-17 |
| si07.fast (download) | 20.2 KB | 2001-01-17 |
| si07.metfst (download) | 10.1 KB | 2001-01-17 |
| si07.metnrm (download) | 10.2 KB | 2001-01-17 |
| si07.metslw (download) | 8.3 KB | 2001-01-17 |
| si07.norm (download) | 17.4 KB | 2001-01-17 |
| si07.slow (download) | 15.9 KB | 2001-01-17 |
| si08.fast (download) | 21.8 KB | 2001-01-17 |
| si08.metfst (download) | 10.5 KB | 2001-01-17 |
| si08.metnrm (download) | 8.4 KB | 2001-01-17 |
| si08.metslw (download) | 7.1 KB | 2001-01-17 |
| si08.norm (download) | 17.0 KB | 2001-01-17 |
| si08.slow (download) | 12.0 KB | 2001-01-17 |
| si09.fast (download) | 20.2 KB | 2001-01-17 |
| si09.metfst (download) | 9.9 KB | 2001-01-17 |
| si09.metnrm (download) | 9.2 KB | 2001-01-17 |
| si09.metslw (download) | 8.3 KB | 2001-01-17 |
| si09.norm (download) | 17.9 KB | 2001-01-17 |
| si09.slow (download) | 16.2 KB | 2001-01-17 |
| si10.fast (download) | 19.1 KB | 2001-01-17 |
| si10.metfst (download) | 9.4 KB | 2001-01-17 |
| si10.metnrm (download) | 9.0 KB | 2001-01-17 |
| si10.metslw (download) | 8.1 KB | 2001-01-17 |
| si10.norm (download) | 17.4 KB | 2001-01-17 |
| si10.slow (download) | 14.9 KB | 2001-01-17 |