=.2in
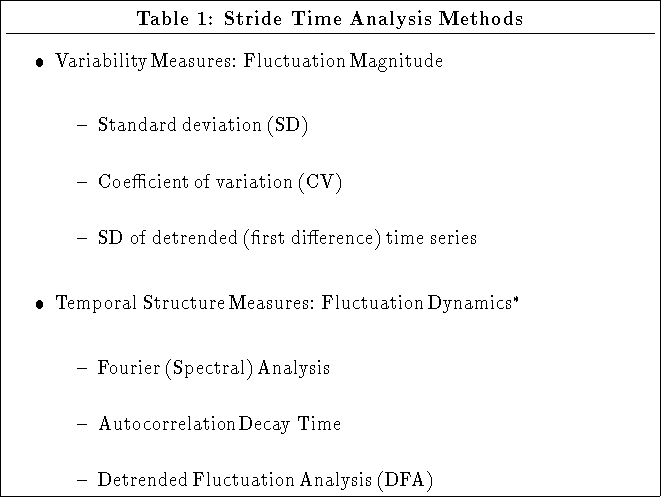
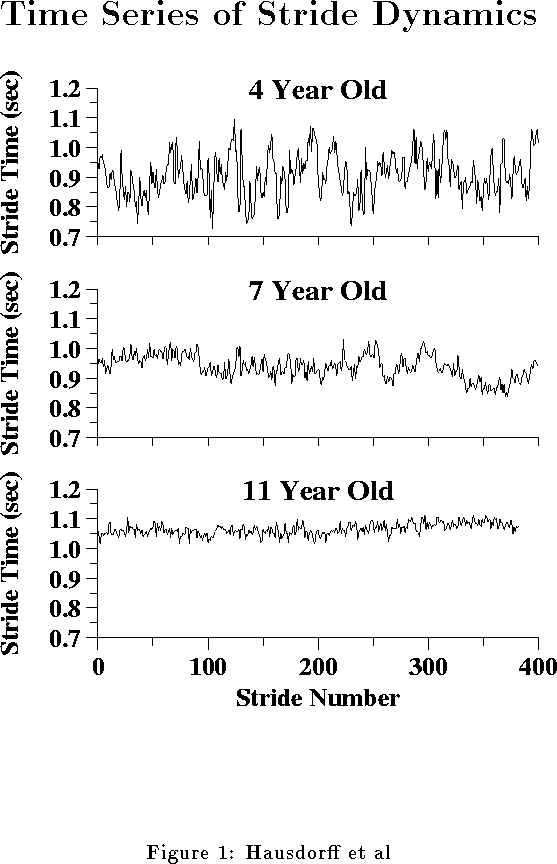
![]() Note that unlike variability measures, temporal structure measures
are sensitive to the order of the data points in the time series.
Note that unlike variability measures, temporal structure measures
are sensitive to the order of the data points in the time series.
| Table 2: Stride Time Variability | ||||
| 3 & 4 Year Olds | 6 & 7 Year Olds | 11--14 Year Olds | ||
| SD (msec) | Original Time Series | 55 | 31 | 23 |
| After Detrending | 48 | 28 | 22 | |
| 1st 30 Strides | 47 | 25 | 17 | |
| CV (%) | Original Time Series | 6.1 | 3.3 | 2.1 |
| Lowest 30 stride segment | 3.1 | 1.8 | 1.2 | |
| 1st 30 Strides | 5.1 | 2.6 | 1.6 | |
SD: standard deviation; CV: coefficient of variation. ![]() and
and ![]() denote p < .005 and p < .0001, respectively,
compared to the 6 and 7 year olds.
denote p < .005 and p < .0001, respectively,
compared to the 6 and 7 year olds. ![]() denotes p < .0001
comparing the oldest and youngest groups.
Kruskal-Wallis tests detected
significant differences among the three groups for all measures (p <
.0001).
denotes p < .0001
comparing the oldest and youngest groups.
Kruskal-Wallis tests detected
significant differences among the three groups for all measures (p <
.0001).
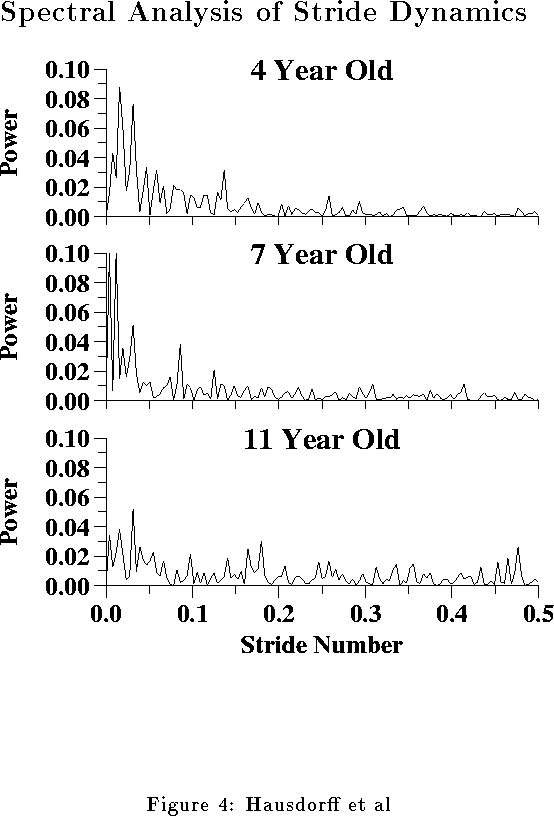
| Table 3: Spectral Analysis | |||
| 3 & 4 Year Olds | 6 & 7 Year Olds | 11--14 Year Olds | |
| % High Frequency Power (0.25--0.5 stride | 0.054 | 0.064 | 0.100 |
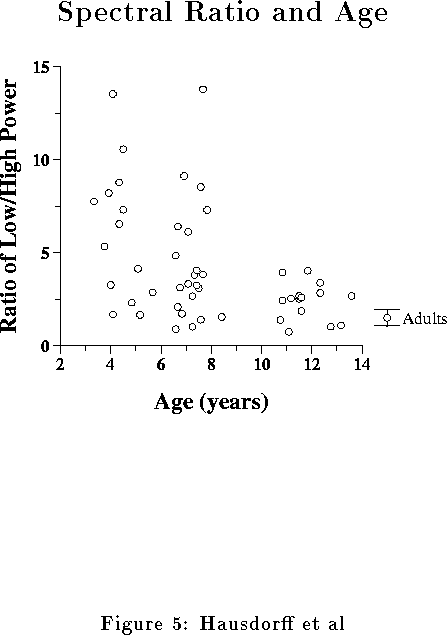
| Low/High Ratio | 6.8 | 4.1 | 2.3 |
| Low/High Ratio after Detrending | 0.30 | 0.20 | 0.15 |
| % High Frequency Power (0.3--0.4 stride | 0.022 | 0.023 | 0.038 |
| Low/High Ratio | 6.8 | 4.5 | 2.3 |
| Low/High Ratio after Detrending | 0.41 | 0.29 | 0.18 |
![]() denotes p < .05
compared to the 6 and 7 year olds.
denotes p < .05
compared to the 6 and 7 year olds.
![]() denotes p < .005
comparing the oldest and youngest groups.
Kruskal-Wallis tests detected
significant differences among the three groups for all measures except high frequency power.
denotes p < .005
comparing the oldest and youngest groups.
Kruskal-Wallis tests detected
significant differences among the three groups for all measures except high frequency power.
|
Table 4: Effects of Age on Stride Time Dynamics | |||
| 3 & 4 Year Olds | 6 & 7 Year Olds | 11--14 Year Olds | |
| Variability | | | -- |
| Low/High Frequency Power | | | -- |
| Autocorrelation Decay Time | | -- | -- |
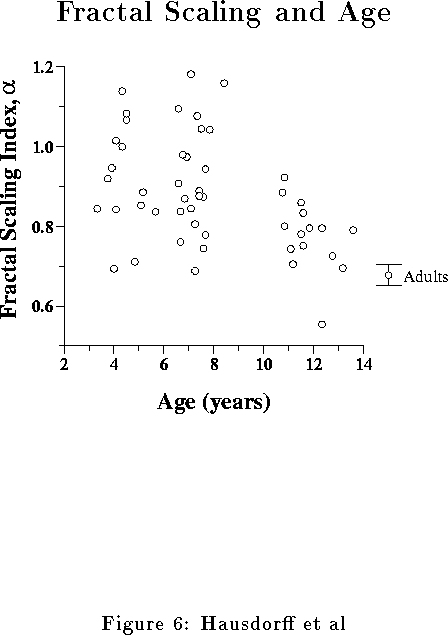
| Fractal Scaling Exponent | | | -- |
![]() Compared to the oldest children in whom stride time dynamics
are the most adult-like.
Note how different aspects of
the temporal structure of the stride dynamics tend to mature at
different ages. (The low/high ratio was not statistically different in the two youngest groups,
however, this representation reflects the observed trend toward a decreased ratio
in the 6 and 7 years olds compared to the 3 and 4 year olds.)
Compared to the oldest children in whom stride time dynamics
are the most adult-like.
Note how different aspects of
the temporal structure of the stride dynamics tend to mature at
different ages. (The low/high ratio was not statistically different in the two youngest groups,
however, this representation reflects the observed trend toward a decreased ratio
in the 6 and 7 years olds compared to the 3 and 4 year olds.)