CVSim has been tested on the following
platforms:
• Windows XP
• Mac OS X PPC
• Mac OS X i386
• Fedora Core 4
• Fedora Core 5
• Red Hat Enterprise
Linux 4
CVSim is not supported on the following
platforms:
• Solaris
In order to run CVSim, you need to install
Java Web Start. Java Web Start is part of the Java Runtime Engine
(JRE). If you are using Windows or Linux, follow the instructions on the Sun website to install JRE 6. If you are using Linux,
you need to perform an extra step and manually install the Java Plugin in your
web browser. If you are using Mac OS X, run Software Update from the
System Preferences. Install Java for Mac OS X 10.4, Release 5.
The first time you run CVSim, you will
see a security warning that asks you, "The application’s
digital signature cannot be verified. Do you want to run the application?".
Click "Run". If you want to avoid that warning in the future,
check the "Always trust content from this publisher" box.
If you are using Internet Explorer, the security warning may be displayed
behind your browser.
Once Java Web Start has been installed on your
system, one of the two links below can be used to start CVSim.
Launch CVSim
[physionet.org]
Launch CVSim [alternate]
If you use a PhysioNet mirror, try the alternate link first; if it doesn't work, the first link can be used to launch CVSim from the master PhysioNet server.
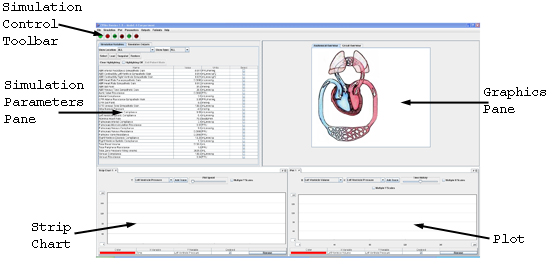
The CVSim window is divided into four sections,
a Simulation Parameters pane, a Graphics pane, a Strip Chart, and
a Plot. There is also a toolbar with simulation controls.

The Simulation Controls toolbar allows
the user to stop and start the simulation and turn the control systems
on and off. The Simulation Parameters pane displays the simulation
variables and outputs. The Graphics pane displays an anatomical and
circuit representation of the simulation model. The strip chart allows
the user to plot simulation outputs versus time. The strip chart behavior
is based on an electrocardiogram (ECG) strip chart recorder. Like
an ECG signal, the strip chart data scrolls from right to left. The
plot allows the user to plot simulation outputs versus one another.
The Simulation Controls toolbar contains
the following components:
•  Start the simulation
 Start the simulation
 •  Stop the simulation
 Stop the simulation
 •  Turn on the arterial baroreflex control system
 Turn on the arterial baroreflex control system
 •  Turn off the arterial baroreflex control system
 Turn off the arterial baroreflex control system
 •  Turn on the cardiopulmonary reflex control system
 Turn on the cardiopulmonary reflex control system
 •  Turn off the cardiopulmonary reflex control system
 Turn off the cardiopulmonary reflex control system
Watch the Simulation Controls Demo.
Watch the Simulation Variables Demo.
Watch the Graphics Pane Demo.
Watch the Strip Chart and Plot Demo.