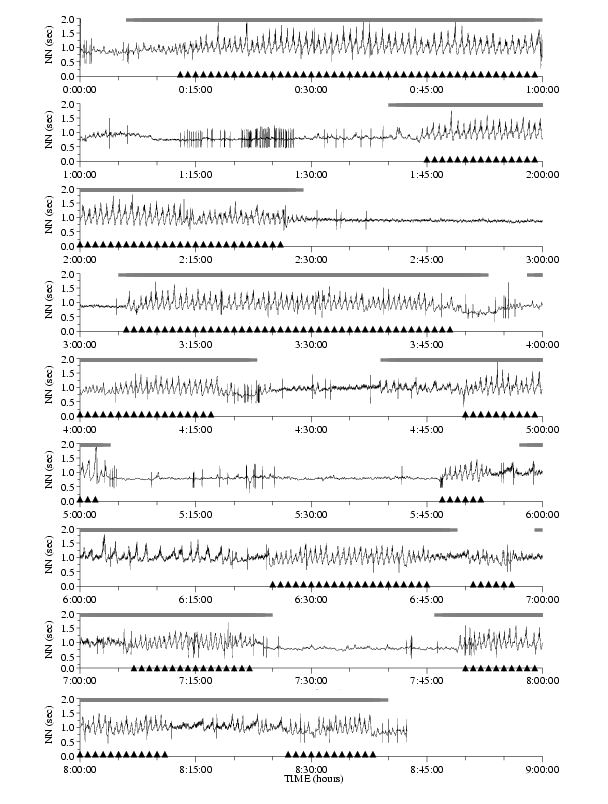
In the figure below, the waveforms show the measured NN intervals (one hour per trace), which are the input to get_apdet. Grey bars above the waveforms indicate obstructive sleep apnea detections reported by get_apdet apnea-ecg/a03 qrs. Black arrows below the waveforms mark apneic intervals determined by expert interpretation of the respiratory waveforms (which were not made available to get_apdet). A higher-resolution PDF version of this figure is available here.
