Challenge Open Access
QT Interval Measurement: The PhysioNet/Computing in Cardiology Challenge 2006
Published: Nov. 1, 2006. Version: 1.0.0
Papers from the PhysioNet/CinC Challenge 2006 (Oct. 16, 2006, midnight)
Papers describing the entries in the PhysioNet/Computers in Cardiology Challenge 2006 are now available, as are the final gold-standard QT measurements for the Challenge database.
Results from the PhysioNet/CinC Challenge 2006 (Sept. 20, 2006, midnight)
The PhysioNet/Computers in Cardiology Challenge 2006 attracted 41 participants, 19 of whom presented papers describing their methods for QT interval measurement at CinC in Valencia. The best score achieved by a manually reviewed entry was 6.67 ms (raw score: 6.65 ms, yield: 0.998), submitted by Mariano Llamedo Soria of the Universidad Tecnologica Nacional FRBA, Buenos Aires, Argentina. In all, seven entries in division 1 received scores below 20 ms. The best score achieved by an automated method was 16.34 ms (raw score: 15.53 ms, yield: 0.951), submitted by Dieter Hayn of ARC Seibersdorf Research GmbH, Graz, Austria. This entry achieved seventh place overall. The best score achieved by an open source automated method was 17.33 ms (raw score: 17.30 ms, yield: 0.998), by Yuriy Chesnokov of the Unilever Centre for Molecular Science Informatics, Cambridge University. This entry achieved ninth place overall, and second among all automated methods. In all, three entrants in divisions 2 and 3 earned scores below 20 ms, and six more received scores below 30 ms. An unofficial entry formed by combining the results of the three top entries in each of divisions 2 and 3 achieved a score of 10.93 ms (raw score: 10.39 ms, yield 0.951).
More news
PhysioNet/CinC Challenge 2006 (Nov. 1, 2005, midnight)
The seventh annual PhysioNet/Computers in Cardiology Challenge has begun. Challenge 2006 offers participants an opportunity to establish the accuracy and reliability of fully automated methods for measuring QT intervals, a topic of interest since regulatory agencies around the world currently endorse only manual and semi-automated methods in clinical trials for new drugs. Visit the Challenge 2006 home page to learn more.
Please include the standard citation for PhysioNet:
(show more options)
Goldberger, A., Amaral, L., Glass, L., Hausdorff, J., Ivanov, P. C., Mark, R., ... & Stanley, H. E. (2000). PhysioBank, PhysioToolkit, and PhysioNet: Components of a new research resource for complex physiologic signals. Circulation [Online]. 101 (23), pp. e215–e220. RRID:SCR_007345.
Introduction
The seventh annual PhysioNet/Computers in Cardiology Challenge addresses a question of high clinical interest:
Can the QT interval be measured by fully automated methods with an accuracy acceptable for clinical evaluations?
The Expert Working Group (Efficacy) of the International Conference on Harmonisation of Technical Requirements for Registration of Pharmaceuticals for Human Use (ICH) has developed and has given its final ("step 4") endorsement in May, 2005 to a set of guidelines (ICH E14) for clinical evaluation of QT/QTc interval prolongation and proarrhythmic potential for non-antiarrhythmic drugs. Quoting from that document:
An undesirable property of some non-antiarrhythmic drugs is their ability to delay cardiac repolarization, an effect that can be measured as prolongation of the QT interval on the surface electrocardiogram (ECG). The QT interval represents the duration of ventricular depolarization and subsequent repolarization, and is measured from the beginning of the QRS complex to the end of the T wave. A delay in cardiac repolarization creates an electrophysiological environment that favors the development of cardiac arrhythmias, most clearly torsade de pointes (TdP), but possibly other ventricular tachyarrhythmias as well. TdP is a polymorphic ventricular tachyarrhythmia that appears on the ECG as continuous twisting of the vector of the QRS complex around the isoelectric baseline. A feature of TdP is pronounced prolongation of the QT interval in the supraventricular beat preceding the arrhythmia. TdP can degenerate into ventricular fibrillation, leading to sudden death.While the degree of QT prolongation is recognized as an imperfect biomarker for proarrhythmic risk, in general there is a qualitative relationship between QT prolongation and the risk of TdP, especially for drugs that cause substantial prolongation of the QT interval. Because of its inverse relationship to heart rate, the measured QT interval is routinely corrected by means of various formulae to a less heart rate dependent value known as the QTc interval. It is not clear, however, whether arrhythmia development is more closely related to an increase in the absolute QT interval or QTc. Most drugs that have caused TdP clearly increase both the absolute QT and the QTc (hereafter called QT/QTc). Documented cases of TdP (fatal and non-fatal) associated with the use of a drug have resulted in the withdrawal from the market of several drugs and relegation of other drugs to second-line status. Because prolongation of the QT/QTc interval is the ECG finding associated with the increased susceptibility to these arrhythmias, an adequate pre-marketing investigation of the safety of a new pharmaceutical agent should include rigorous characterization of its effects on the QT/QTc interval.
On first consideration, QT interval measurement in the ECG might seem a rather worked-out problem. In comparison with manual methods, automated methods offer advantages in terms of absolute repeatability of measurements, immunity from errors related to observer fatigue, lapses of attention, and transcription, as well as efficiency and cost considerations that permit either more extensive and rigorous testing for the same cost as manual methods, or more rapid testing at lower cost. An extensive literature documents a wide variety of approaches to the problem.
This topic has acquired renewed importance, however, as regulatory agencies worldwide are moving toward requiring "thorough QT/QTc studies" (as defined in the ICH E14 guidelines) as part of clinical trials for all newly developed drugs. ICH E14 guidelines have been adopted and published by the US FDA, the EU's European Medicines Agency, and Japan's National Institute of Health Services. Among much else, the guidelines endorse manual QT interval measurement for "thorough QT/QTc studies", and cite the need for further research before the use of fully automated methods can be accepted in these studies:
Several methods for measuring ECG intervals have been used in clinical trials, and for a given trial, the sponsor should describe the accuracy and precision of QT/QTc interval measurements using the selected system. The method chosen will depend on the level of precision appropriate for a given trial. For example, the "thorough QT/QTc study" would warrant particularly careful attention to interval measurement. At present, this would usually involve the measurement by a few skilled readers (whether or not assisted by computer) operating from a centralized ECG laboratory. If well-characterized data validating the use of fully-automated technologies become available, the recommendations in the guidance for the measurement of ECG intervals could be modified. [emphasis added]
Thus it is clear from the text of the ICH E14 guidelines that regulatory agencies are currently unconvinced of the reliability of automatic QT interval measurements. A major part of the motivation for this year's challenge is to provide well-characterized data that might support modifications of the ICH E14 recommendations with respect to fully-automated methods.
Independent of these considerations, the QT interval measurements obtained as a product of this Challenge will support further research aimed at designing robust measures of repolarization characteristics. The difficulty of making accurate measurements of QT intervals on individual beats is a hindrance to studies of variability of repolarization (for example, in exercise). By creating a collection of reference QT intervals that have been measured by many expert observers and automated methods, the Challenge can be a starting point for future studies of alternative measurements that may be possible to derive reliably even when QT intervals cannot be determined directly.
Challenge Overview
The Challenge will include separate divisions (and awards) for participants using manual and semi-automated methods (division 1), and fully automated methods (divisions 2 and 3). By doing so, we aim to establish a firm basis for assessing the accuracy and reliability of fully automatic methods for QT interval measurement, as compared to the manual and semi-automated methods currently endorsed by the ICH E14 guidelines.
One of PhysioNet's major goals is to foster the creation and free dissemination of high-quality open-source software for research on clinically and scientifically interesting subjects. Software contributed in the course of previous Challenges has stimulated new collaborations among its authors, and offers rare opportunities to compare the strengths of varied approaches objectively. Authors of fully automated algorithms may enter division 3 (the "open source" division) by submitting their source code. We encourage participation in this activity as part of the Challenge, and we offer an additional award to the author(s) of the most successful algorithm submitted in source form. We will select well-constructed submissions and will post them with full credit to their authors on PhysioNet following the conclusion of the Challenge.
As in our previous Challenges, the data needed by participants can be found on PhysioNet. Participants will select a representative beat from each record in the challenge database and will measure the times of the PQ junction (the Q-wave onset) and the end of the T-wave for that beat, from which the QT interval for that record will be derived by subtraction. Participants will submit entries containing their PQ and T-end measurements to PhysioNet for scoring.
On Wednesday, 20 September 2006, during a plenary session of Computers in Cardiology 2006 in Valencia, Spain, we will present four awards of US$250 each: for the best (lowest) final score overall, and for the best final scores in division 1, divisions 2 and 3, and division 3. Eligible participants may receive more than one award.
Following the conclusion of the challenge, the final sets of reference QT intervals, together with the entire set of submitted PQ and T-end measurements, will be made available on PhysioNet. Among the questions that may be answerable using this set of measurements are:
- Which records, if any, exhibit clinically significant differences between the medians of the fully automated measurements and those of the manual or semi-automated measurements? (These records would warrant special attention, because they have features likely to confuse either algorithms or humans.)
- Which records, if any, exhibit clinically significant differences between the minimum and maximum manually-measured QT intervals? (These would be of interest for the same reason as the previous group; in addition, the incidence of such records would be of interest in establishing the reliability of manual measurements.)
- Are there identifiable subsets of the records that are particularly well-measured, or particularly troublesome, for specific algorithms? (These could be valuable in developing an algorithm that incorporates multiple approaches to provide increased accuracy or reliability.)
- Do specific algorithms exhibit systematic bias (consistently over- or underestimating QT intervals)? Such a finding might point the way to trivial algorithm changes that might improve accuracy.
- Are there clinically significant differences between manual, semi-automated, and fully automated measurements of QT intervals? We hope to show that (at least for a subset of fully automated measurement algorithms) no such differences exist.
The Challenge Database
The data to be used for this year's challenge are the 549 recordings of the PTB Diagnostic ECG Database, which was contributed to PhysioNet in September 2004 by its creators (Michael Oeff, Hans Koch, Ralf Bousseljot, and Dieter Kreiseler of the Physikalisch-Technische Bundesanstalt in Berlin). Each of these recordings contains 15 simultaneously recorded signals: the conventional 12 leads and the 3 Frank (XYZ) leads. Each of these is digitized at 1000 samples per second, with 16 bit resolution over a range of ±16.384 mV. The records come from 294 subjects (each represented by one to five records) with a broad range of ages and diagnoses. About 20% of the subjects are healthy controls. A detailed clinical summary accompanies each record. The records are typically about two minutes in length, with a small number of shorter records (none less than 30 seconds).
To Participate in the Challenge, You Will Need To
- develop methods (which may be fully automated, semi-automated, or manual) to locate the PQ junction (the onset of the Q-wave) and the T-wave end of a representative beat in a 12-lead ECG
- apply your methods to obtain the times of occurrence of the PQ junction and T-wave end of the first representative beat in each recording in the challenge database
- follow the instructions on the entry form to submit your results to PhysioNet for scoring
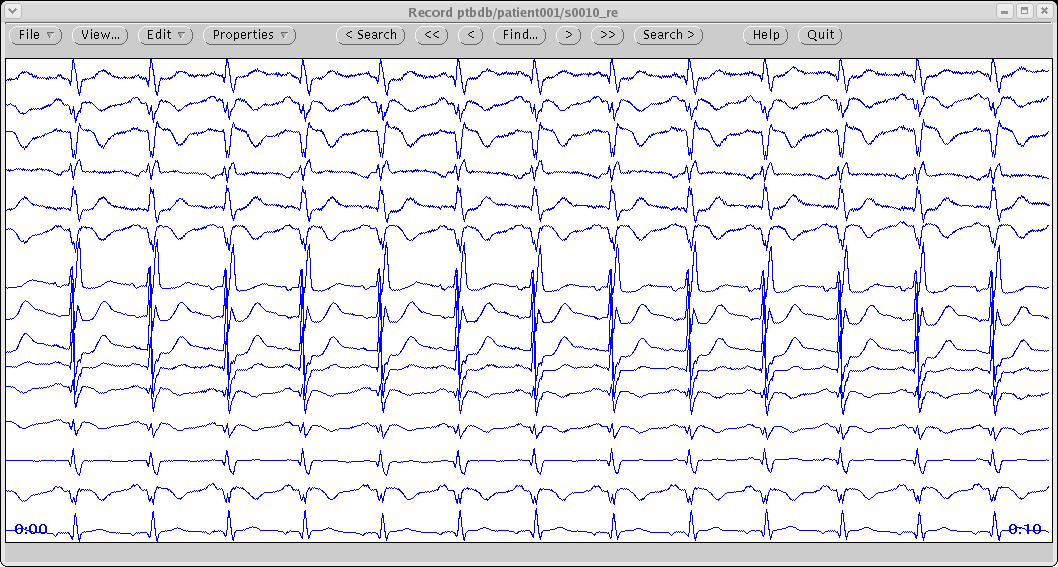
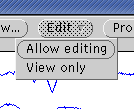
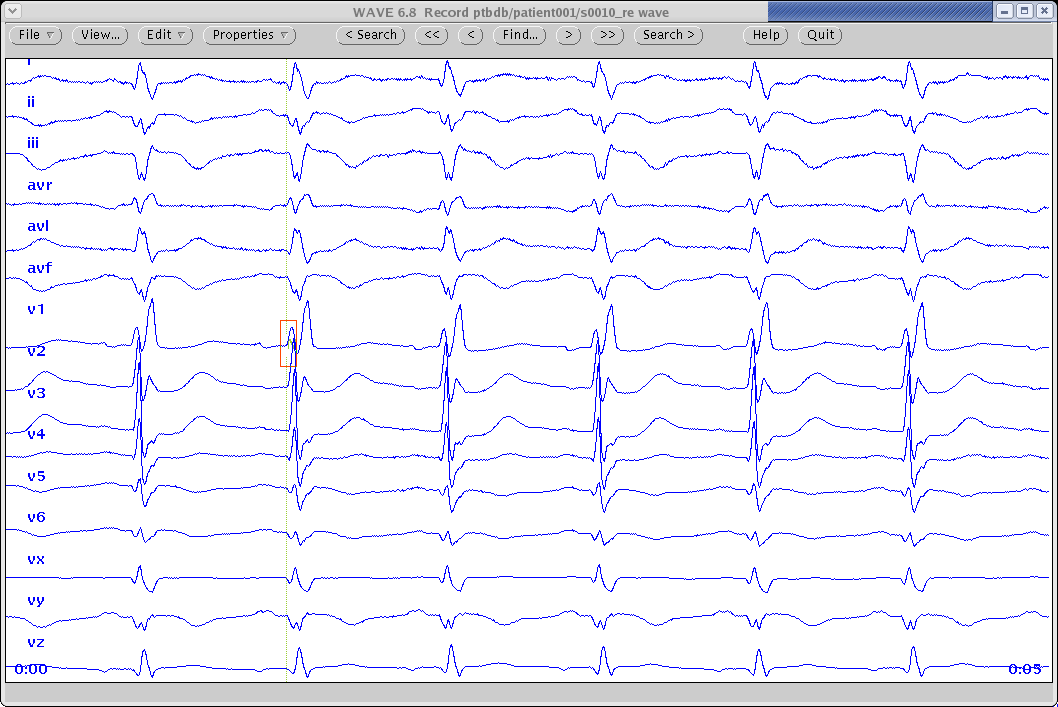
To make your measurements of each record, choose the first beat that you consider to be representative (not ectopic, and free of significant noise, artifact, and baseline wander in lead II). In lead II, measure to the nearest millisecond the times of the PQ junction (Q-wave onset) and T-wave end, and record these times (i.e., the elapsed times in milliseconds from the beginning of the record) in your entry form. An illustrated example of this procedure is available here.
To be Eligible for an Award, You Will Also Need To
- submit at least one eligible entry (due Monday, 24 April 2006 at noon GMT)
- submit an abstract (due Monday, 1 May 2006, and required only for divisions 2 and 3), describing your methods and discussing your findings, to Computers in Cardiology 2006
- submit your source code (due Friday, 8 September 2006, and required only for division 3)
- submit a four-page manuscript (due Wednesday, 20 September 2006, if your abstract is accepted) for publication in the conference proceedings
- attend Computers in Cardiology 2006, to be held 17-20 September 2006 in Valencia, Spain
Eligible Entries
Eligible entries must be in plain text format, in the format of the template. Don't submit HTML documents, MS Word .doc files, spreadsheets, or anything else except plain text. Be sure to fill in your name, email, and the Challenge division (1, 2, or 3) at the top of the form in the indicated spaces. Follow the instructions on the form to submit your entry.
You may elect to omit measurements for some records. If your automated methods determine that a particular record cannot be measured reliably, omitting measurements for that record may be preferable to supplying unreliable measurements. If your measurements are made manually or semi-automatically, you need not measure all of the records, although it will be to your advantage to measure as many as possible, because of the way the scores are calculated. Entries in division 1 must include measurements for at least 50% (275) of the 549 records in order to be eligible for an award. Entries in the other two divisions require measurements for at least 95% (522) of the records. Qualified participants may receive more than one award.
Update: (27 July 2006) If the time given for the PQ follows that given for the T end in any record, this record is treated as omitted when scores are calculated. If the PQ and T end measurements are not associated with the same beat, this is an error.
You may revise your entry at any time until the final entry deadline of 4 September 2006 at 8 pm (2000) GMT. Each time you do so, your previous entry is discarded. Only the last entry received from each participant on or before the final entry deadline will be used to determine the winners of the Challenge.
Exception: (added 13 April 2006) If you wish to enter independent sets of measurements made using substantially different methods (for example, a set of automated measurements in division 2 or 3, and a set of manual measurements in division 1), at the discretion of the organizers these may be considered simultaneously valid. If you believe that this exception should apply to your entries, please write for approval and special instructions, with a brief description of how your methods differ. This approval is not automatic and will require showing that the results of the two methods are significantly different.
Scoring
An unusual feature of this Challenge is that the "gold standard" (reference) QT interval measurements that are the basis for scoring each entry will be determined from the entries themselves during the course of the Challenge.
For each record, the QT interval measurements obtained from the most recent entry submitted by each participant will be pooled to determine a median, which will be taken as the reference QT interval for that record. (Update 27 July 2006: Given the large number of division 1 (manual/semiautomated) entries, it is feasible now to determine the medians from the latest entry submitted by each division 1 participant, and this has been done for medians and scores calculated on or after 27 July.) The score for each entry will be a function of the amount of agreement with the reference QT intervals and the number of records measured. Reference QT intervals and scores will be calculated at several times during the challenge; they will not be updated each time an entry is received.
The score for each entry will be calculated as the RMS difference between the reference QT intervals and the corresponding QT intervals determined from the times listed in the entry, divided by the fraction of records in the challenge database for which measurements were submitted. Lower scores are better.
Preliminary scores will be provided to participants shortly after the first deadline (24 April 2006), and updates will be supplied from time to time thereafter, each time the reference QT intervals are recalculated. Final scores will be emailed to participants on or about Wednesday, 6 September 2006.
Awards
During a plenary session of Computers in Cardiology in September, four awards of US$250 each will be presented to the eligible participants with the best (lowest) final scores as follows:
- Best overall (participants in all divisions eligible)
- Manual and semi-automated methods (division 1 only)
- Fully automated methods (divisions 2 and 3 eligible)
- Fully automated methods with source code submitted (division 3 only)
Entering Division 3
Authors of fully automated methods may enter division 3 by sending their source code by email, before noon GMT on Friday, 8 September 2006, to PhysioNet. Use the subject line "Challenge 2006 entry source", and be sure to include:
- Your name and email address
- All sources needed to produce a working version of your software (except for readily available standard libraries and header files)
- A note describing how to produce a working version of your software (a commented Makefile is ideal), and how to run your software
Each source file submitted should begin with a comment block containing the names of its authors and a reference to the open source license you have chosen for it, if any; for example:
     /* qtpom.c - Find QT intervals based on the phase of the moon
        Copyright (C) 2006  Herman Foobar
        This software is released under the terms of the GNU General
        Public License (http://www.gnu.org/copyleft/gpl.html).
     */
Source files in C, C++, Fortran, or Matlab m-code are preferred; other languages may be acceptable, but please ask first. Do not submit any code that cannot be freely redistributed. Note that entries in division 3 are eligible for three of the four awards (best overall, best fully automated method, and best open source method). Good luck!
Writing Abstracts and Papers for CINC
To be eligible for awards, participants in divisions 2 and 3 must submit abstracts about their work to Computers in Cardiology; division 1 participants are encouraged but not required to do so.
The abstract due on 1 May 2006 is limited to about 400 words (no figures or tables may be included). For examples of abstracts that have been submitted by participants in past Challenges, see these two from the 2005 Challenge.
Abstracts must be submitted on-line on the Computers in Cardiology web site. When submitting your abstract, select "Computers in Cardiology Challenge" as the topic on the web form, so that your abstract can be identified easily by the abstract review committee.
Successful abstracts include brief descriptions of the scope of the work, the methods used, the results, and conclusions. If accepted, these abstracts are printed in the scientific program book distributed at the conference, and those for Challenge entries are also posted here. They do not appear in print elsewhere; these are understood to be preliminary in nature and subject to revision between May and September. Nevertheless, you should include whatever preliminary results you have as of the time of the abstract submission; abstracts promising only that "results will be presented" are not accepted.
If your abstract is accepted, you will be expected to prepare a full 4-page paper describing your work in detail. This paper will have an abstract of its own, considerably shorter than the abstract you submitted for the program book. You can (and should) incorporate relevant results that you obtain during the months between submitting your original abstract and the deadline for the paper in September. You will receive your final score on or about 6 September 2006, about two weeks before your paper is due, so that it can be included in the paper if you wish.
When you are ready to begin writing your paper, get the Author's Kit, which includes templates and detailed instructions for preparing your manuscript in the required format and submitting it on-line.
Your paper must be presented in an assigned oral or poster session at Computers in Cardiology in order for it to appear in print in the proceedings of the conference.
Important Dates
Late submissions will not be accepted.
- Monday, 24 April 2006, noon GMT
- Deadline for submission of initial entries to PhysioNet. If you have missed this deadline, we encourage you to participate unofficially (your measurements will be scored and may be pooled with official entries to determine the reference QT intervals, but will not be eligible for an award).
- Monday, 1 May 2006
- Deadline for submission of abstracts for Computers in Cardiology 2006.
- Monday, 4 September 2006, 8 pm (2000) GMT
- Deadline for submission of final entries to PhysioNet.
- Wednesday, 6 September 2006
- Final scores sent to all participants.
- Friday, 8 September 2006, noon GMT
- Deadline for submission of source code of division 3 entries to PhysioNet.
- Sunday-Wednesday, 17-20 September 2006
- 33rd annual conference on Computers in Cardiology, Valencia, Spain.
- Wednesday, 20 September 2006
- Deadline for submission of full papers for publication. Please don't wait until the last minute!
Frequently Asked Questions
What happens when an entry is submitted?
Once enough entries have been received, we will calculate the median QT interval reported for each record. Since it would be possible for an unscrupulous participant to bias the medians by submitting many entries with the same or slightly different measurements, only the last entry received from each participant is entered into the pool used to determine the medians.
The median QT intervals determined in this way become the reference ("gold standard") against which each participant's measurements are compared. Since new entries affect the medians, we will calculate new medians from time to time during the challenge, and we will recalculate scores at those times.
Scores will be sent by email whenever new scores are calculated. Participants should expect to receive a preliminary score on or about Wednesday, 26 April 2006 (a few days before the CinC abstract deadline), and a final score on or about Wednesday, 6 September 2006 (about two weeks before the CinC final paper deadline). We expect that additional preliminary scores will be sent to participants at various other times during the spring and summer. Please be sure that your email address as recorded in your entry form is valid so that you will be able to receive your scores.
Why did the autoscorer reject my entry?
Eligible entries must be in plain text format, as in the template. Don't submit HTML documents, MS Word .doc files, spreadsheets, or anything else except plain text; the autoscorer won't like it!
How are the scores determined?
There are two components of the score. First, we measure the mean of the squared differences between your QT interval measurements and the corresponding reference QT intervals, and take the square root of that number, to obtain the RMS error for your entry. (Since the time units are milliseconds, the units of RMS error are also milliseconds.) Second, we count the number of records measured in your entry, and divide that number by 549 (the total number of records in the challenge database), to obtain the yield for your entry. Your score is your RMS error divided by your yield; since yield is dimensionless, the units of the score are milliseconds.
What do the scores mean, and what's a good score?
A lower score (ideally obtained with low RMS error and high yield) is always better. The best scores closely reflect the expected difference between a participant's measurements and the median of a set of manual measurements, in milliseconds. This interpretation of the score may be less appropriate when applied to poor scores, since low yield makes a score worse (higher).
What constitutes a good score is subjective, but (as of 27 July) about a third of the scores in division 1 were near or below 20, and about a third of the division 2 and 3 scores were near or below 30.
How can my score be changing if I haven't revised my measurements?
Since the measurements contained in the submitted entries determine the reference QT intervals, your scores are not final until no more entries can be accepted. Preliminary scores based on available entries will be provided from time to time; the first scores will be emailed shortly after the first deadline in April.
Can I enter the challenge using previously published open-source software for fully automated QT interval measurement?
If you are the author of the software, yes, certainly!
An entry produced by a functionally identical copy of someone else's code is not acceptable. If you are not the original author of the software, your entry is acceptable only if you have modified the original code in a non-trivial way, and if your QT interval measurements are no longer identical to those of the original software. It will be very difficult to establish the acceptability of a division 2 entry based on someone else's open source code, so if you are considering making such an entry, you are strongly encouraged to do so in division 3, where the significance of your modifications can be properly assessed.
This policy is intended to protect the interests of any participants who might wish to publish their code before the conclusion of the Challenge, while still encouraging others to experiment with published algorithms and to contribute improvements to them if they can.
What license should be used for software entered in division 3?
Participants may choose any open source license (or none at all). We use and recommend the GPL for our own software posted on PhysioNet, but this is not a requirement for the Challenge.
Can I enter the challenge using a semi-automated method?
Yes, you may participate in division 1. We also encourage you to submit an abstract to Computers in Cardiology and to submit your source code for possible posting on PhysioNet, but these are not requirements for division 1 participants.
I select a representative beat manually, and my software locates the PQ junction and T-wave end automatically. Which division should I enter?
Your method is semi-automated, since it requires human input; enter division 1.
Should I choose the first beat in the record as the representative beat even if the record begins in the middle of the QRS complex?
No, definitely not! You should choose the first representative beat in the record, which for reasons discussed below will never (well, hardly ever) be the first beat.
You can decide for yourself which beats are representative (typical), and you should choose one of them for your measurements. Among the characteristics that define a representative beat is that it should not immediately follow an atypical beat, because an atypical beat may (and usually does) influence the characteristics of the immediately following beat. This would tend to rule out using the first beat in any record, since the preceding beat cannot be examined and it is therefore not possible to say if it was atypical.
If the first beat appears similar to the second beat and to most of the others in the record, and the second beat is clean, then the second beat is an ideal choice for the representative beat.
If, after looking at the entire record, you decide that only the first beat is clean enough to measure, and that it looks typical, then use the first beat if you wish. This is the only situation in which you should consider choosing the first beat in a record, and it is unlikely to be necessary in the Challenge dataset.
My software denoises the signals, so I don't need to choose a clean beat to measure. Does it really matter?
It is certainly possible that your denoising may do an excellent job, but keep in mind that for the purposes of the Challenge, your measurements will be compared against those made by other participants, and that there are (real) beat-to-beat variations in QT interval. All other things being equal, your results will be best if you measure the same beat as the majority of other participants, so yes, it does really matter that you try to use the same criteria for choosing this beat as everyone else does!
We specified the first representative beat in the record because even respiration-related interbeat interval variations may be reflected in the QT interval. Our hope is that most participants will choose one of a very small number of possibilities in each record, and that the inter-observer variability will be smaller than would be expected if each participant chose a random representative beat (and a wider variety of respiratory phases were sampled in the pooled data for each record).
We could have left this problem out of the challenge by designating a specific beat to be measured in each record, but the issue of choosing a typical beat to characterize the record is an important aspect of arriving at a reliable method for measuring QT intervals, given current standards of clinical practice. It is certainly debatable whether measuring a QT interval from a single beat should ever be considered a reliable basis for making clinical decisions, but that's a debate for another time (and maybe another challenge!).
Why do you allow division 1 participants to measure only half of the database?
We want to encourage as many entries in division 1 as we can, and we expect that some participants will not have the time to measure the entire set of records in the challenge database. The inclusion of the yield (see "How are the scores determined?" above) in the score calculation is intended to give everyone, and especially participants in division 1, an incentive to measure as many records as possible.
Why don't you have a challenge about ...?
Each year, we receive many suggestions for challenge topics. We encourage you to contact us with further suggestions.
Acknowledgments
Special thanks to Hans Koch at PTB Berlin for proposing this Challenge, to his colleague Uwe Steinhoff for valuable discussions at CinC 2005 in Lyon, and to Michael Oeff, Hans Koch, Ralf Bousseljot, and Dieter Kreiseler of PTB Berlin for their generous contribution of the excellent PTB Diagnostic ECG Database used in this Challenge. Thanks also to Uwe Steinhoff and Raphael Schneider for compiling the reading list below.
Further Reading
During the development of the CSE Database, a "median self-centering approach" was followed to evaluate the performance of different algorithms for measuring ECG waveforms. The methods used in this Challenge for bootstrapping the determination of the reference QT intervals, and of scoring the entries, were inspired by this important and closely related work, which is described in these papers:
- Willems JL, Arnaud P, van Bemmel JH, Bourdillon PJ, Brohet C, Dalla Volta S, Andersen JD, Degani R, Denis B, Demeester M, et al. Assessment of the performance of electrocardiographic computer programs with the use of a reference data base. Circulation. 1985 Mar; 71(3):523-534.
- Willems JL, Abreu-Lima C, Arnaud P, Brohet CR, Denis B, Gehring J, Graham I, van Herpen G, Machado H, Michaelis J, et al. Evaluation of ECG interpretation results obtained by computer and cardiologists. Methods Inf Med. 1990 Sep; 29(4):308-316.
- Reddy BR, Xue Q, and Zywietz C. Analysis of interval measurements on CSE multilead reference ECGs. J Electrocardiol. 1996; 29 Suppl:62-66.
- Willems JL, Abreu-Lima C, Arnaud P, van Bemmel JH, Brohet C, Degani R, Denis B, Graham I, van Herpen G, Macfarlane PW, et al. Effect of combining electrocardiographic interpretation results on diagnostic accuracy. Eur Heart J. 1988 Dec; 9(12):1348-1355.
- Willems JL, Abreu-Lima C, Arnaud P, van Bemmel JH, Brohet C, Degani R, Denis B, Gehring J, Graham I, van Herpen G, et al. The diagnostic performance of computer programs for the interpretation of electrocardiograms. N Engl J Med. 1991 Dec 19; 325(25):1767-1773.
- [The CSE Working Party] Recommendations for measurement standards in quantitative electrocardiography. Eur Heart J. 1985 Oct; 6(10):815-825.
- Michaelis J, Wellek S, and Willems JL. Reference standards for software evaluation. Methods Inf Med. 1990 Sep;29(4): 289-297.
Algorithms for automated measurement of QT intervals have been described in a number of papers; here are a few:
- Laguna P, Jané R, Caminal P. Automatic detection of wave boundaries in multilead ECG signals: validation with the CSE database. Computers and Biomedical Research, 1994 Feb; 27(1):45-60.
- Jané R, Blasi A, García J, and Laguna P. Evaluation of an automatic threshold based detector of waveform limits in Holter ECG with the QT database. Computers in Cardiology 1997; 24:295-298. [Software]
- Li C, Zheng C, and Tai C. Detection of ECG characteristic points using wavelet transforms. IEEE TBME 1995 Jan; 42(1):21-28.
- Martinez JP, Almeida R, Olmos S, Rocha, AP, and Laguna P. A wavelet-based ECG delineator: evaluation on standard databases. IEEE TBME 2004 Apr; 51(4):579-581.
- Addison PS. Wavelet transforms and the ECG: a review. Physiol. Meas. 2005; 26:R155-R199.
Two abstracts presented at Computers in Cardiology 2005 may also be of interest:
- Zhang Q, Illanes Manriquez A, Medigue C, Papelier Y, and Sorine M. An algorithm for robust and efficient location of T-wave ends in electrocardiogram.
- Lindauer JM and Gregg RE. Evaluation of Philips diagnostic ECG interval measurements.
Your suggestions for additions to this list are welcome and will be gratefully acknowledged if used.
Challenge Results
The Challenge attracted 41 participants, 19 of whom presented papers describing their entries at CinC in Valencia. The best score achieved by a manually reviewed entry was 6.67 ms (raw score: 6.65 ms, yield: 0.998), submitted by Mariano Llamedo Soria of the Universidad Tecnologica Nacional FRBA, Buenos Aires, Argentina. In all, seven entries in division 1 received scores below 20 ms. The best score achieved by an automated method was 16.34 ms (raw score: 15.53 ms, yield: 0.951), submitted by Dieter Hayn of ARC Seibersdorf Research GmbH, Graz, Austria. This entry achieved seventh place overall. The best score achieved by an open source automated method was 17.33 ms (raw score: 17.30 ms, yield: 0.998), by Yuriy Chesnokov of the Unilever Centre for Molecular Science Informatics, Cambridge University. This entry achieved ninth place overall, and second among all automated methods. In all, three entrants in divisions 2 and 3 earned scores below 20 ms, and six more received scores below 30 ms. An unofficial entry formed by combining the results of the three top entries in each of divisions 2 and 3 achieved a score of 10.93 ms (raw score: 10.39 ms, yield 0.951).
Papers
These papers were presented at Computers in Cardiology 2006. Please cite this publication when referencing any of these papers. These papers have been made available by their authors under the terms of the Creative Commons Attribution License 2.5 (CCAL). We wish to thank all of the authors for their contributions.
These papers were presented during the special Kraal session at Computers in Cardiology in Valencia on Tuesday, 19 September 2006. The first of them is an introduction to the challenge topic, with a summary of the challenge results and a discussion of their implications.
The PhysioNet / Computers in Cardiology Challenge 2006: QT Interval Measurement
GB Moody, H Koch, U Steinhoff
[Also see the poster]
The remaining papers were written by participants in the Challenge, who describe their approaches to the challenge problem.
A Semi-Automatic QT Interval Measurement Based on Digital Filters
CY Wu, HW ChiuFully Automated Method for QT Interval Measurement in ECG
II Christov, II SimovaChallenge 2006: QT Interval Measurement
R Schneider, A Bauer, P Barthel, G SchmidtIntegrative Approach for the Measurement of the QT Interval
MA Mneimneh, RJ Povinelli, MT JohnsonCardiac Model Based Approach to QT Estimation
RJ Povinelli, MA Mneimneh, MT JohnsonIndividually Adaptable Automatic QT Detector
YV Chesnokov, D Nerukh, RC GlenStability of QT Measurements in the PTB Database Depending on the Selected Lead
JP Martínez, R Almeida, S Olmos, AP Rocha, P LagunaFully Automated Computer Measurement of QT Interval from the 12-Lead ECG
P Langley, FE Smith, ST King, D Zheng, AJ Haigh, A MurrayAutomatic QT Interval Measurement Using Rule-Based Gradient Method
V Chudacek, M Huptych, D Novak, L LhotskaAutomated QT Interval Analysis on Diagnostic Electrocardiograms
DA Tironi, R Sassi, LT MainardiModel-Based Determination of QT Intervals
GD Clifford, M VillarroelIdentifying and Measuring Representative QT Intervals in Predominantly Non-Normal ECGs: The Computers in Cardiology Challenge 2006
S Mensing, W Bystricky, A SaferAlgorithmic Testing for QT Interval Measurement
G BortolanAutomatic Multilead VCG Based Approach for QT Interval Measurement
R Almeida, JP Martínez, AP Rocha, S Olmos, P LagunaReliable Automated QT Interval Measurement for Clinical Evaluation
W Xie, X Chen, L Dong, ZK Tin, M SankaranarayananA QT Interval Detection Algorithm Based on ECG Curve Length Function
W Zong, M Saeed, T HeldtAutomated QT Interval Measurement from Multilead ECG Signals
D Hayn, A Kollmann, G Schreier
The paper below, which does not appear in Computers in Cardiology 2006, was contributed to PhysioNet by participants who were unable to present their work in Valencia.
A Semi-Automated QT Interval Measurement Based on Wavelet and Energy Analysis
M Ghasemi, H SadAbadi
Access
Access Policy:
Anyone can access the files, as long as they conform to the terms of the specified license.
License (for files):
Open Data Commons Attribution License v1.0
Project Views
38
Current Version38
All VersionsCorresponding Author
Versions
Files
Access the files
- Download the ZIP file (10.9 MB)
-
Download the files using your terminal:
wget -r -N -c -np https://physionet.org/files/challenge-2006/1.0.0/
-
Download the files using AWS command line tools:
aws s3 sync --no-sign-request s3://physionet-open/challenge-2006/1.0.0/ DESTINATION
| Name | Size | Modified |
|---|---|---|
| measurements | ||
| papers | ||
| sources | ||
| example.html (download) | 6.1 KB | 2019-04-17 |
| p77-2.htm (download) | 1.4 KB | 2019-04-17 |
| reference-QT.txt (download) | 20.0 KB | 2019-04-17 |
| s94-2.htm (download) | 2.4 KB | 2019-04-17 |
| template.txt (download) | 12.7 KB | 2019-04-17 |
| wave-1.png (download) | 34.7 KB | 2019-04-17 |
| wave-2.png (download) | 54.8 KB | 2019-04-17 |
| wave-3.png (download) | 4.4 KB | 2019-04-17 |
| wave-4.png (download) | 44.4 KB | 2019-04-17 |
| wave-5.png (download) | 59.5 KB | 2019-04-17 |
| wave-annot-template.png (download) | 7.0 KB | 2019-04-17 |